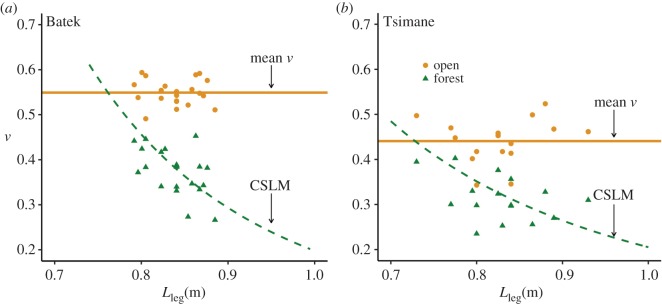
Figure 4.
CSLM predictions in the forest environment. Panels (a) and (b) plot dimensionless speed (v) versus Lleg for the Batek and the Tsimane, respectively. Data points represent individual means (orange circles = open, green triangles = forest). v was essentially constant in the open (horizontal orange lines indicate mean population v in the open). Constrained relationships are plotted using the mean population Lstep for the forest environments (0.74 m for the Batek, 0.60 m for the Tsimane) inserted into equation (1.4) and are represented by the green dashed curves. In contrast to the trend observed in the open, v decreased with Lleg in the forest. Matched-pairs t-tests indicated significantly reduced v in the forest compared to the open (see main text). Note that speed costs predicted by the CSLM can be visualized as the difference between the orange and green curves (figure 5 for depiction on the dimensioned axis). (Online version in colour.)

