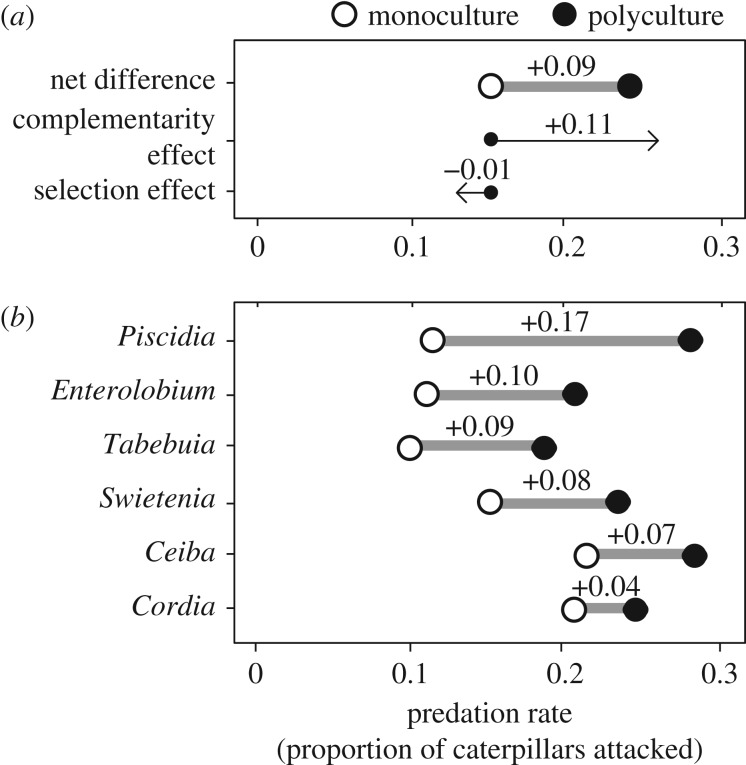
Figure 3.
Differences in model attack rates between monoculture (open circles) and polyculture plots (filled circles). (a) Net plot-level effects depict mean expected polyculture values (weighted average of monocultures) and observed polycultures. This net effect is then decomposed into selection and complementarity effects. (b) Tree-level effects, comparing attack rate for each tree species when grown in monoculture versus tree-level attack rates when the species is included in polyculture.

