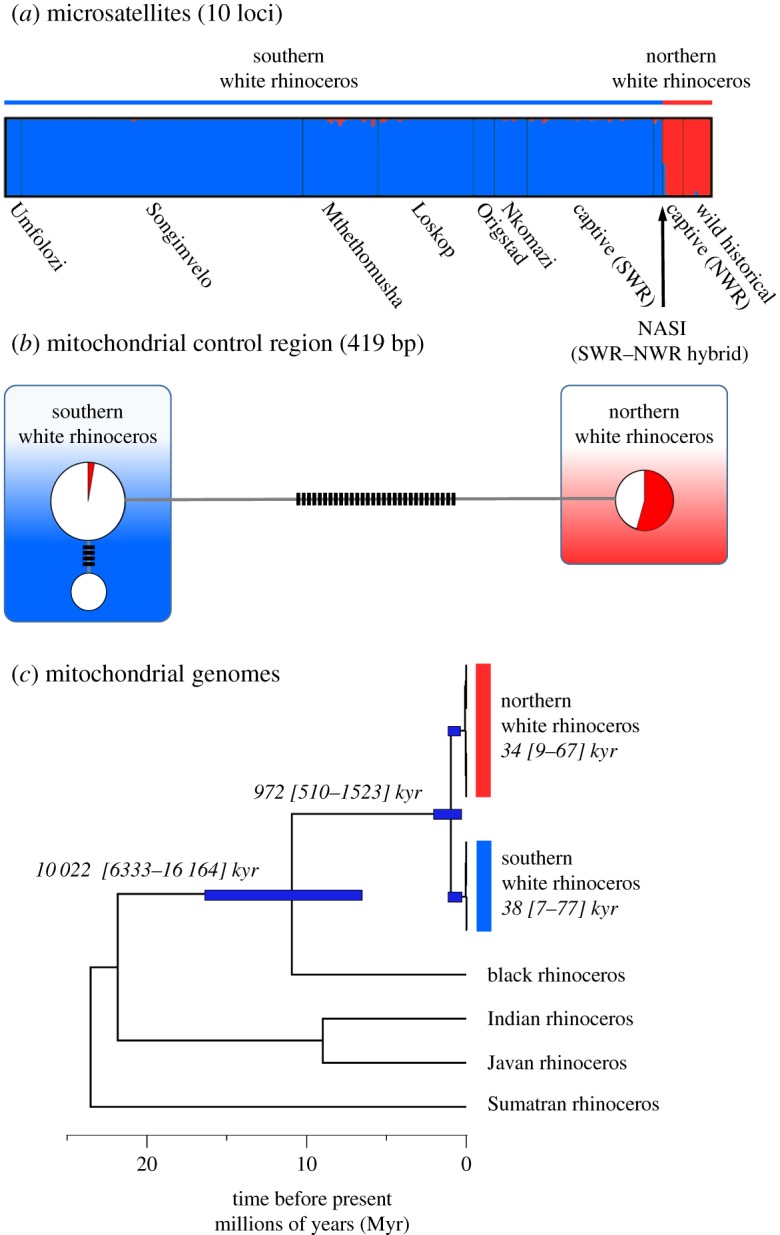
Figure 1.

Genetic structure of the white rhinoceros showing clear separation into two populations. (a) Structuring of multilocus nuclear microsatellite profiles (k = 2). (b) Network of three mitochondrial control region haplotypes (circles) dividing the two white rhinoceros populations into distinct clades. Mutational steps are given as small black bars. (c) Bayesian-dated whole mitochondrial genome phylogeny of the extant Rhinocerotidae. (Online version in colour.)
