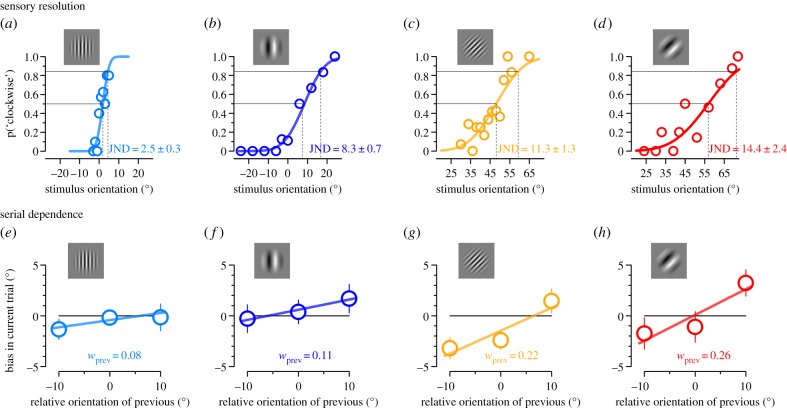
Figure 3.
Orientation discrimination and serial dependence for gratings of different base orientation and spatial frequency. (a–d) Psychometric curves for discriminating which of two Gabors was more clockwise as function of the orientation of the second stimulus. The dashed vertical lines indicate 1 standard deviation, which we take as the estimate of just-noticeable difference (JND). (e–h) Bias in current trial induced by the relative orientation of the previous stimulus. The slope of the curve returns the loading of previous stimulus orientation on the current judgement and indicates serial dependence, indicated as weight. Cartoon of the stimuli (low or high spatial frequency, cardinal or oblique) are shown in insets.

