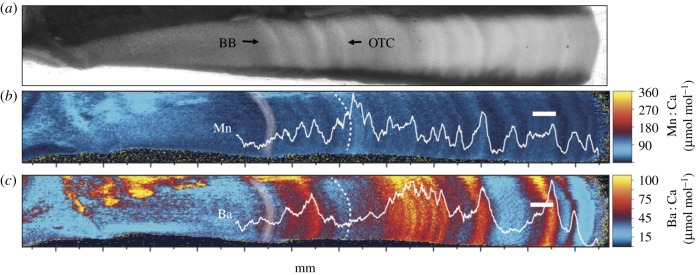
Figure 2.
(a) Image of shortfin mako (ID: A038423) vertebrae under transmitted light, and (b,c) two-dimensional elemental map of (b) manganese and (c) barium variation. Birth band (BB) denoted in (b) and (c) with white shading and oxytetracycline band (OTC) denoted with dashed lines. Translucent zones (hypermineralized, slow growth) in a), matches with Mn decreases; opaque hypomineralized high protein zones matches with Mn peaks. White scale bar, 500 µm.

