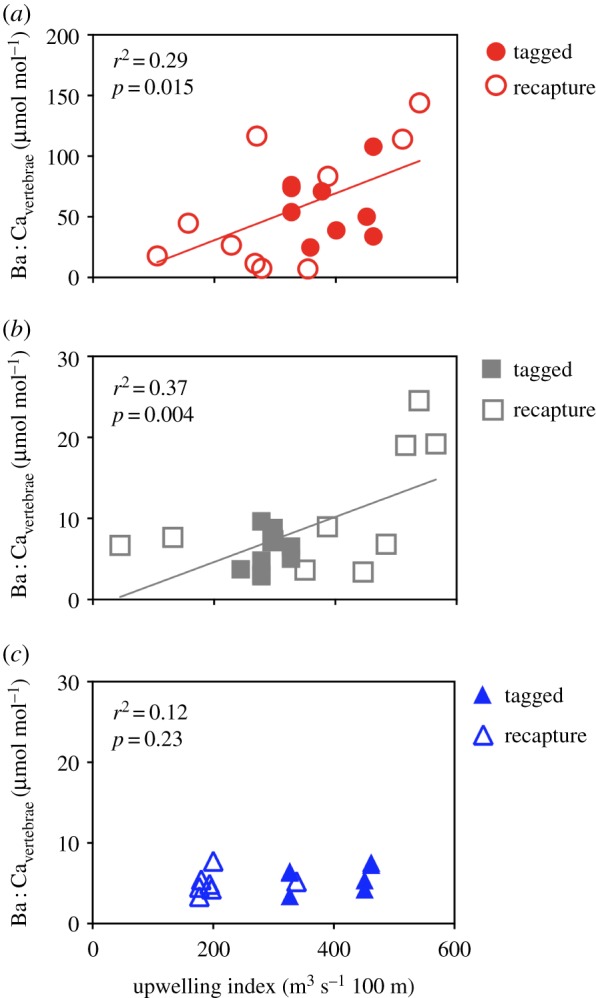
Figure 4.

Relationship between cumulative monthly upwelling index (month of capture + previous month) at nearest station and Ba : Ca in vertebrae from known OTC tagging location (solid symbols) and known recapture location (open symbols) for (a) shortfin mako red circles), (b) common thresher (grey squares) and (c) blue shark (blue triangles). Solid coloured lines indicate linear regression equations. (Online version in colour.)
