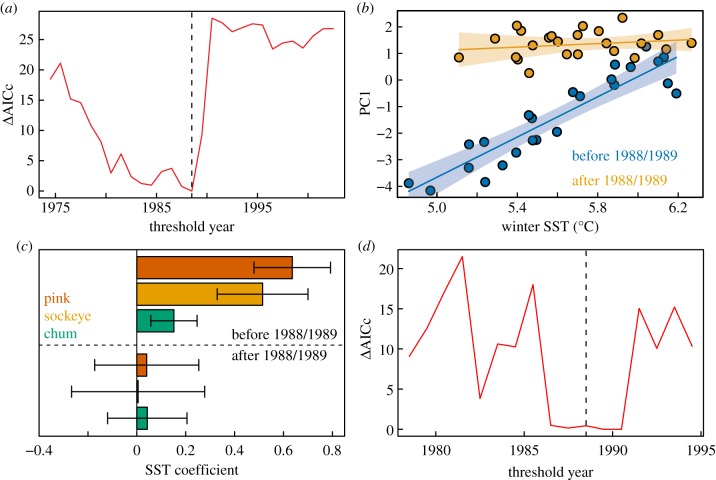
Figure 5.
Non-stationary SST–salmon relationships in the Gulf of Alaska. (a) Model selection results comparing support for different timing of changing SST–catch PC1 relationships; lowest values indicate strongest support for a particular year as the timing of change. (b) Catch PC1 versus SST before/after the best threshold year (1988/1989): linear regressions with 95% CI. (c) SST effects on productivity (recruits per spawner) for wild runs before/after 1988/1989: estimated coefficients and 95% CI. (d) Model selection results comparing support for different timing of changing SST effects on pink salmon recruits per spawner. Vertical dashed lines in (a,d) indicate 1988/1989.

