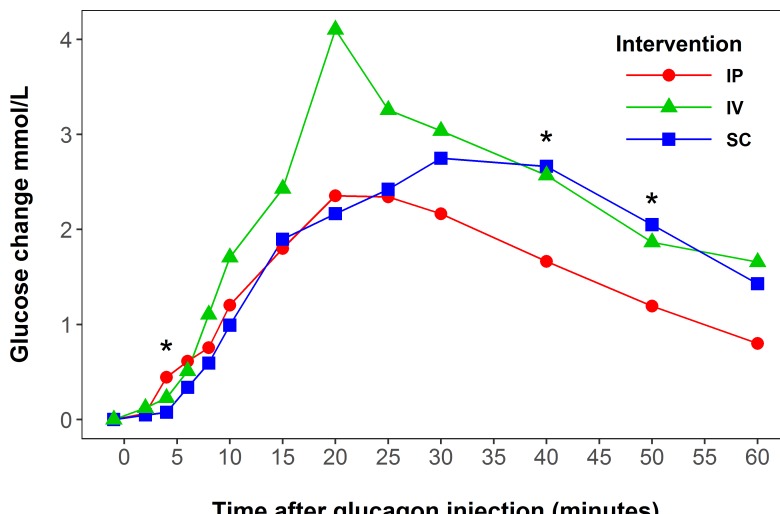
Figure 1.
Estimated glucose delta values (mmol/L) after glucagon injection (5 µg/kg) in octreotide-treated rats. Green line represents intravenous (IV) intervention, blue line represents subcutaneous (SC) intervention, and red line represents intraperitoneal (IP) intervention. The glucose response for the placebo group has been subtracted from all groups presented in the figure. *Represents significant difference between intraperitoneal and subcutaneous of glucagon delivery. Note: For one rat in intraperitoneal intervention, delta values were calculated using the −5 minute measurement (−1 minute for other rats).

