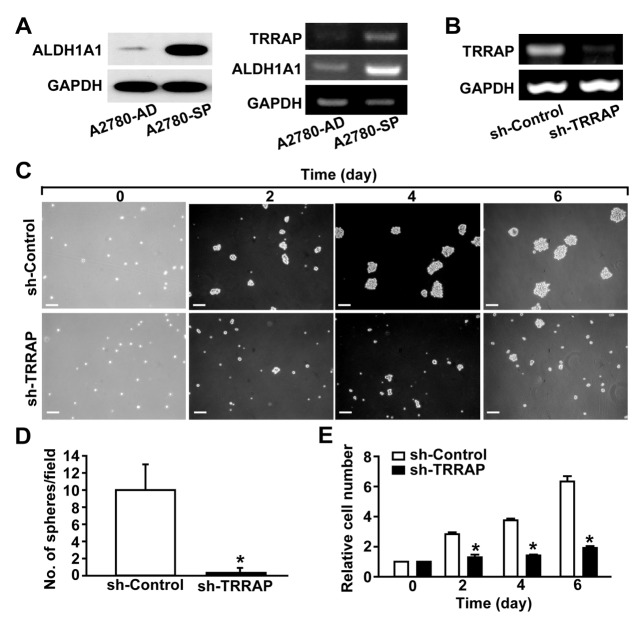
Fig. 1.
Effects of TRRAP knockdown on the proliferation of ovarian CSCs. (A) Increased expression of TRRAP in A2780-SP cells. The protein levels of ALDH1A1 and GAPDH were determined through Western blotting (Left panels). The mRNA levels of TRRAP, ALDH1A1, and GAPDH in A2780-AD and A2780-SP cells were determined by RT-PCR (Right panels). (B) shRNA-mediated knockdown of TRRAP in A2780-SP cells. A2780-SP cells were infected with lentiviruses harboring control shRNA (sh-control) or TRRAP shRNA (sh-TRRAP), and the mRNA levels of TRRAP and GAPDH were determined by RT-PCR. (C) A2780-SP cells were infected with sh-control or sh-TRRAP lentivirus, and bright field images of the spheroid cells are shown from day 0 to day 6. Scale bar = 100 μm. (D) Numbers of spheroids were quantified six days after infecting cells with lentiviruses bearing sh-control or sh-TRRAP. (E) Effects of TRRAP knockdown on the proliferation of A2780-SP cells. The cell numbers were counted from days 0 to 6 after TRRAP knockdown. Results are presented as mean ± SD. *P < 0.05 (n = 6).

