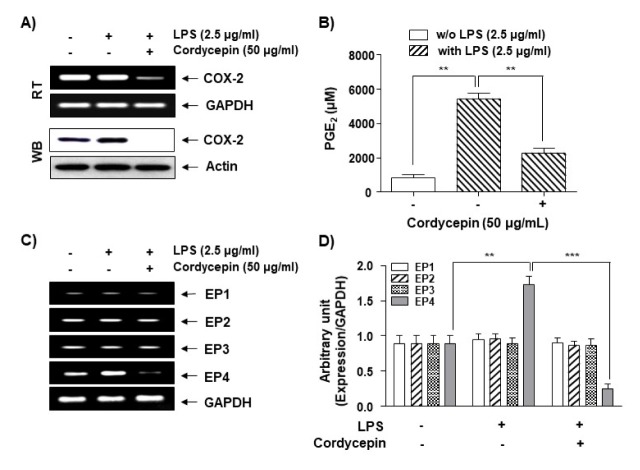
Fig. 2.
Inhibitory effects of cordycepin on PGE2 production and expression of COX-2 and EPs in LPS-stimulated HCT-116 cells. Cells were pre-treated with 50 μg/ml of cordycepin for 1 h prior to incubation with LPS for 48 h. Total RNA (A; upper panel) and proteins (A; lower panel) were prepared and used for the RT-PCR analysis of COX-2 gene expression with GAPDH as an internal control. Actin was used as an internal control. (B) The culture supernatants were isolated, and the amount of PGE2 production was determined. The data are expressed as the mean ± SD of three independent experiments. **P < 0.01 compared to LPS alone. (C) Total RNA was prepared and used for RT-PCR analysis of EP1-4 gene expression. (D) The data represent the EP1-4 mRNA levels in the LPS-treated cultures compared with control cultures from three independent experiments (**P < 0.01, ***P < 0.001).

