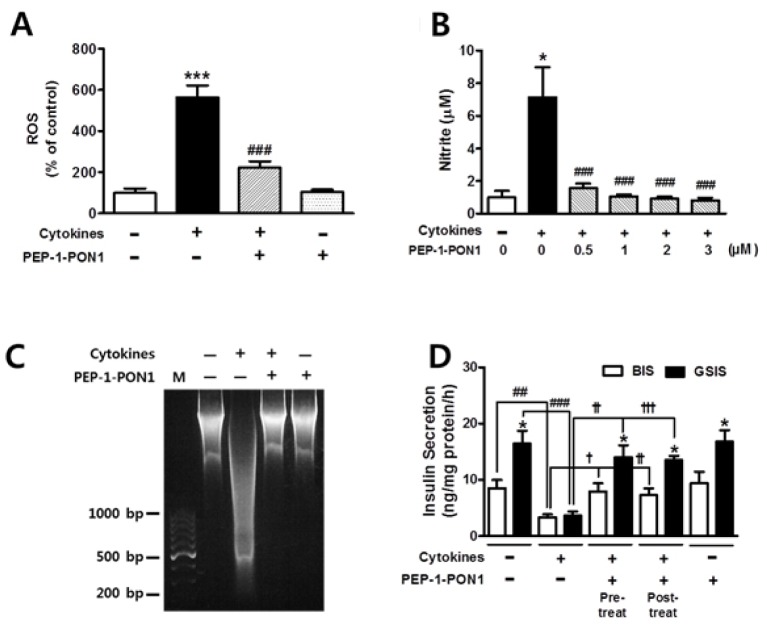
Fig. 3.
Effects of transduced PEP-1-PON1 on the ROS and nitrite levels in cytokine-treated INS-1 cells (A, B). Cells pretreated with 2 μM PEP-1-PON1 were incubated with a combination of cytokines for 24 h. Effect of transduced PEP-1-PON1 on cytokine-induced DNA fragmentation (C). INS-1 cells pretreated with 2 μM PEP-1-PON1 were incubated with a combination of cytokines for 24 h. Total DNA extracted from the cells was separated on 1.2% agarose gel. M; 100-bp DNA ladder marker. Effect of transduced PEP-1-PON1 on insulin secretion in cytokine-treated INS-1 cells (D). In the pretreated group, cells pretreated with 2 μM PEP-1-PON1 were incubated with a combination of cytokines in KRBH buffer at 37°C for 1 h. In post-treated group, the cells were treated with a combination of cytokines for 1 h, and subsequently treated with 2 μM PEP-1-PON1 in KRBH buffer at 37°C for 1 h. BIS; basal insulin secretion, GSIS; glucose-stimulated insulin secretion. Insulin secretion from the cells was quantified using an insulin ELISA kit and adjusted by the cellular protein content. Bars in the figures represent the mean ± SEM obtained from 5–8 independent experiments. *P < 0.05 and ***P < 0.001, compared to the untreated control group or the corresponding BIS group, and ##P < 0.01 and ###P < 0.001, compared to the cytokine-treated group, and †P < 0.05, ††P < 0.01, and †††P < 0.001, compared to the cytokine-treated group.

