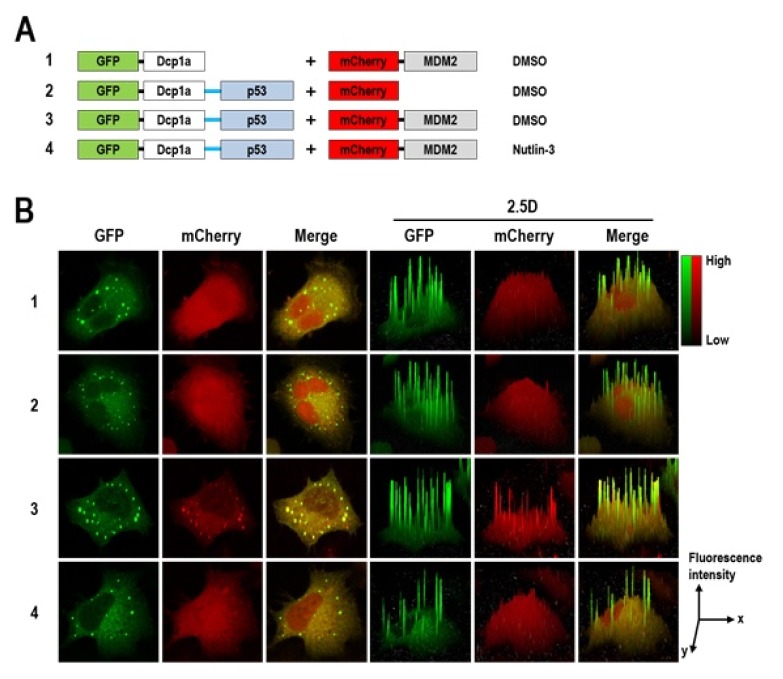
Fig. 3.
Monitoring the dissociation of p53/MDM2 interaction by Nutlin-3. (A) Schematic diagrams of pairs of bait and test fusion proteins. (B) HeLa cells were transfected with pairs of plasmids as shown in panel (A). Twenty-four hours after transfection, cells were fixed and visualized under confocal microscopy. Before cell fixation, 1 μM of Nutlin-3 was treated for 30 min to disrupt p53/MDM2 interaction. The 2.5D surface plots represent the level of intensity of p53/MDM2 interaction.

