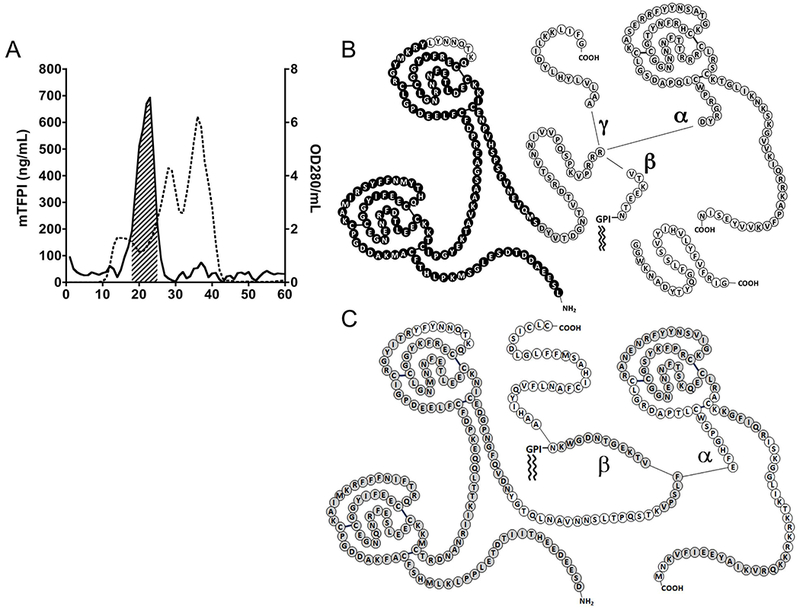
Figure 2.

Characterization of mouse and human plasma TFPI. (A) A representative Sephacryl 300 sizeexclusion chromatography of mouse plasma. Shown are mTFPI by ELISA (solid line) and protein based on OD280 (dotted line); the hash-marked area indicates the lipoprotein fractions pooled for further processing. (B) MS/MS analysis of mouse TFPI. Amino acids in black correspond to peptide spectra identified in the mouse lipoprotein-associated TFPI sample; amino acids in light gray correspond to additional peptide spectra identified in the total mouse plasma TFPI sample; and amino acids in white correspond to regions where no corresponding peptide spectra were identified in either sample. (C) MS/MS analysis of human TFPI. Amino acids in gray correspond to peptide spectra identified in the total human plasma TFPI sample; and amino acids in white correspond to regions were no corresponding peptide spectra were identified.
