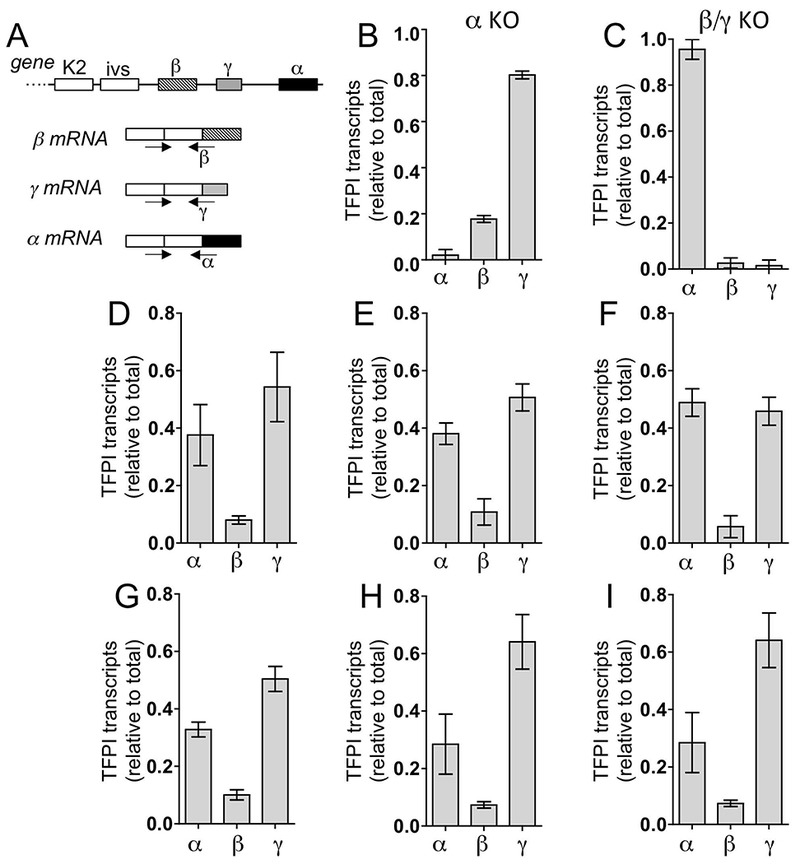
Figure 3.

Quantification of mTFPI isoform transcripts. (A) Scheme for isoform-specific amplifications. Selectivity of each RT-PCR assay is indicated by the effect of (B) α-exon deletion on TFPIα transcripts and (C) TFPIβ/γ-exon deletions on TFPI β, and γ transcripts in lung. Shown are means + SEM (n=3/group). The relative levels of each TFPI isoform transcript were determined for (D) brain; (E) heart; (F) kidney; (G) liver; (H) lung; and (I) spleen of WT mice. Shown are means + SEM (n=5/group).
