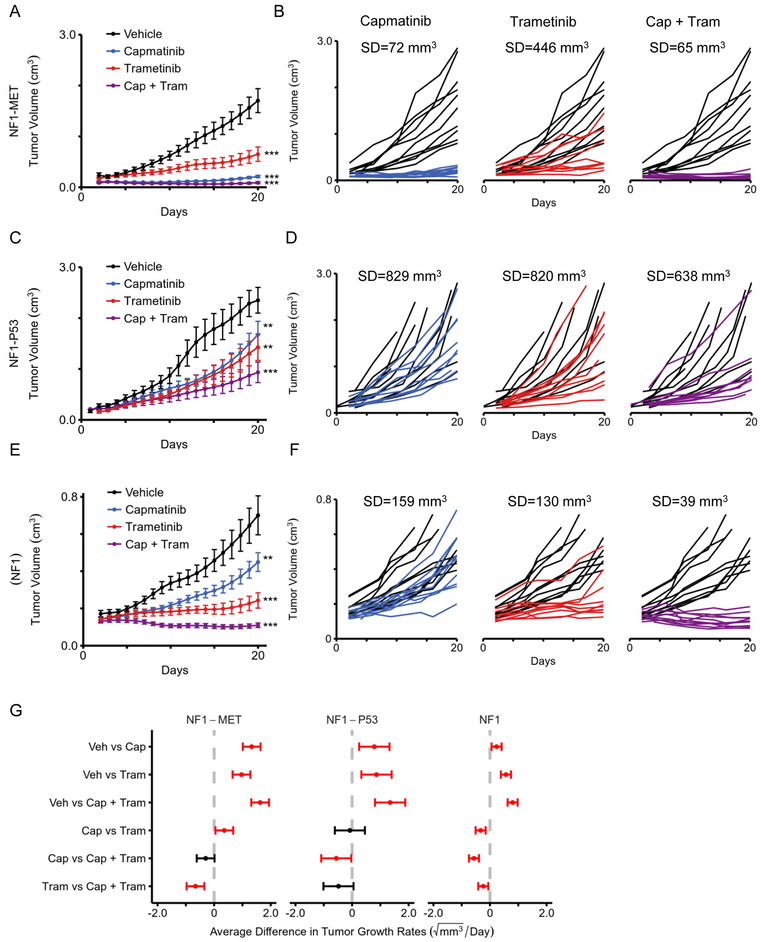
Figure 4: Combined MET and MEK inhibition significantly decreases tumor growth and response variability.
Tumor growth of (A) NF1-MET, (C) NF1-P53, and (E) NF1 tumorgrafts are plotted as means with standard errors. Tumor volume was imputed using last observation carried forward, until animal was euthanized. Curves terminate once >50% of mice have been euthanized in the respective treatment group. Individual tumor growth for (B) NF1-MET, (D) NF1-P53, and (F) NF1 tumorgrafts plotted by treatment (colored lines) compared to vehicle (black lines). (G) 95% confidence intervals for the pairwise differences between the growth rates of the select treatments, estimated and tested using linear mixed-effects models with random slopes and intercepts, and false discovery rate adjusted contrasts. Statistically significant differences (p-value < 0.05) between compared therapies are highlighted in red. * p-value < 0.05, ** p-value < 0.01, *** p-value < 0.001.

