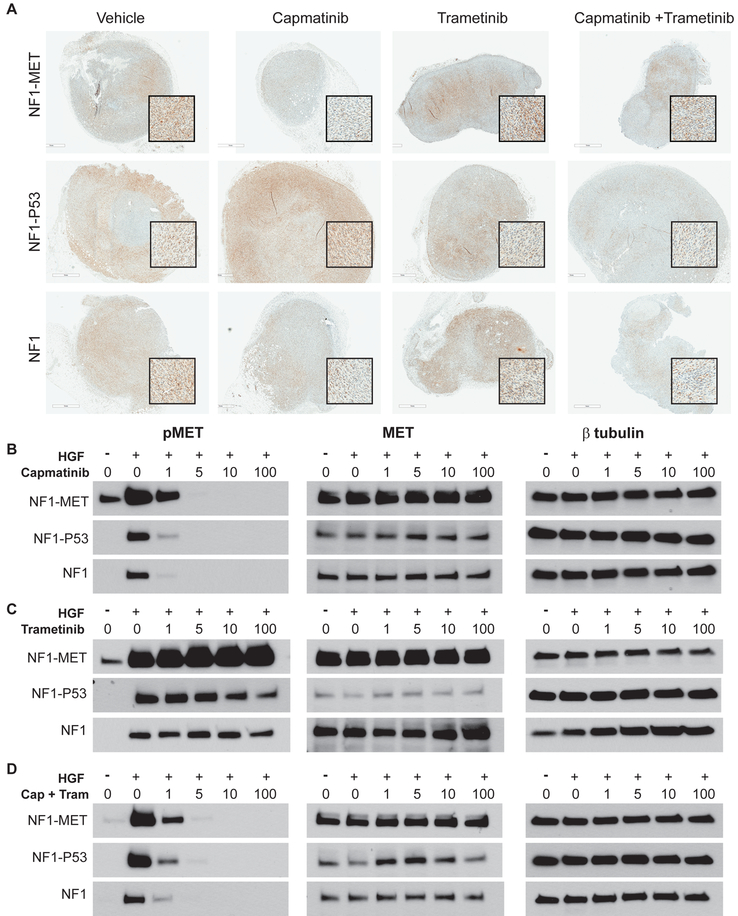
Figure 5: Effects of MET and MEK inhibition on MET activation in NF1 MPNST Models.
(A) Immunostaining of pMET (Y1234/1235) in MPNST models that were treated with kinase inhibitors for 2 days (areas of strongest signal are shown in the magnified inset boxes). (B-D) Western Blot analysis of MPNST cells treated with TKIs for 2 hours and +/− HGF for pMET (left panels), total MET (middle panels), and β-tubulin control (right panels). *The total MET exposure for the NF1-MET cells was half the time of the NF1-P53 and NF1 cells.

