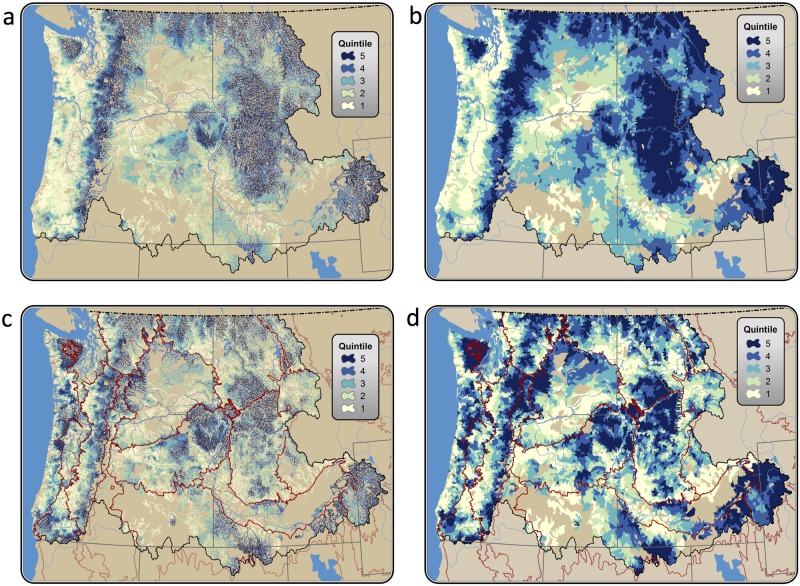
Fig 4. Riparian climate-corridor index values for the Pacific Northwest.
Values are averaged across nested watershed scales (6th to 1st field HUCs), attributed to streamlines associated with potential riparian corridors. Values are shown by quintile for the Pacific Northwest, USA (panels a and b), and within ecoregions (panels c and d); and for both individual riparian corridors (panels a and c) and averaged across 6th field HUCs (panels b and d).

