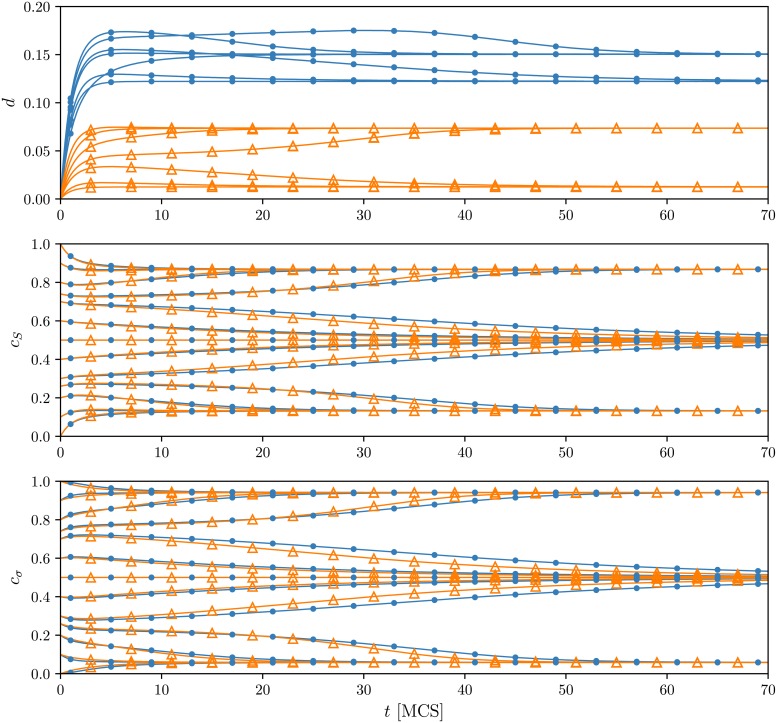
Fig 4. Average trajectories of the dissonance and concentration of positive opinions.
Results for the dissonance are presented in top panels, whereas results for public and private opinions in the middle and bottom panels respectively. Analytical results are marked by solid lines. Symbols illustrate outcomes from Monte Carlo simulations: △ for the TA (think then act) and • for the AT (act then think) models. The system is comprised of N = 106 agents with the independence level p = 0.2 and q = 6 in all cases. Note that these parameters correspond to the metastable region where order (c ≠ 1/2) and disorder phases (c = 1/2) coexist, so that the hysteresis appears, see Fig 1. These two different phases and the dependence between initial and final states of the system is clearly seen in the figures. The trajectories are averaged over 100 samples.

