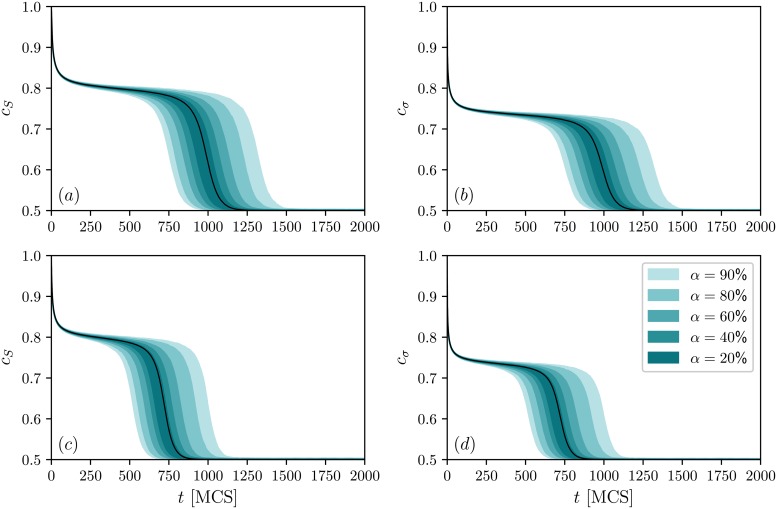
Fig 5. Empirical quantiles of sample trajectories of public and private opinions.
Results for public opinions are presented on the left panels (a) and (c), whereas results for private opinions on the right panels (b) and (d). Top panels (a)-(b) correspond to TA and bottom panels (c)-(d) to the AT updating schemes. Marked with colors are the intervals containing α realizations closest to the median (for example, when α = 80% the lower bound of the marked area is the 10-th percentile, and the upper bound is the 90-th percentile). The quantiles were calculated for each time point separately. Black curves are the average trajectories based on an analytical description of the system. The simulation results were obtained using 103 independent trajectories for the system of N = 106 nodes, parameter q = 5 and p = 0.2664. The initial state of the system is Si(0) = σi(0) = 1 for all agents.

