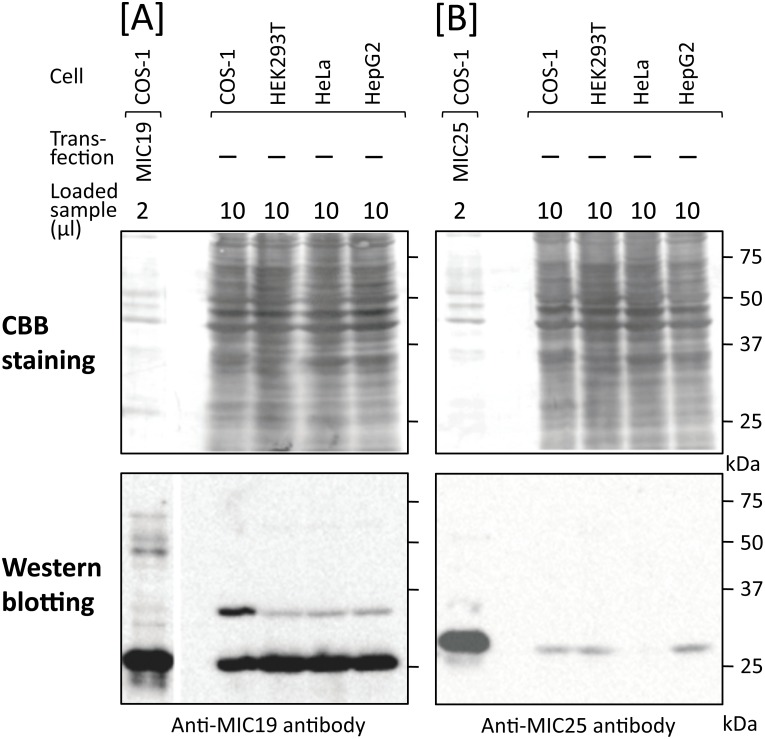
Fig 10. Comparison of the relative amounts of MIC19 and MIC25 expressed in mammalian cells.
The expression levels of endogenous MIC25 in four mammalian cell lines (COS-1, HEK293T, HeLa, HepG2 cells) were compared with those of MIC19 by western blotting analysis using tag-free MIC19 and tag-free MIC25 expressed in COS-1 cells as standard proteins. For this analysis, total cell lysates derived from the four cell lines were subjected to western blotting analysis using anti-MIC19 or anti-MIC25 antibodies. A; Expression of MIC19, B; Expression of MIC25, Upper panels; Coomassie-brilliant blue (CBB) staining, Lower panels; Western blotting analysis.

