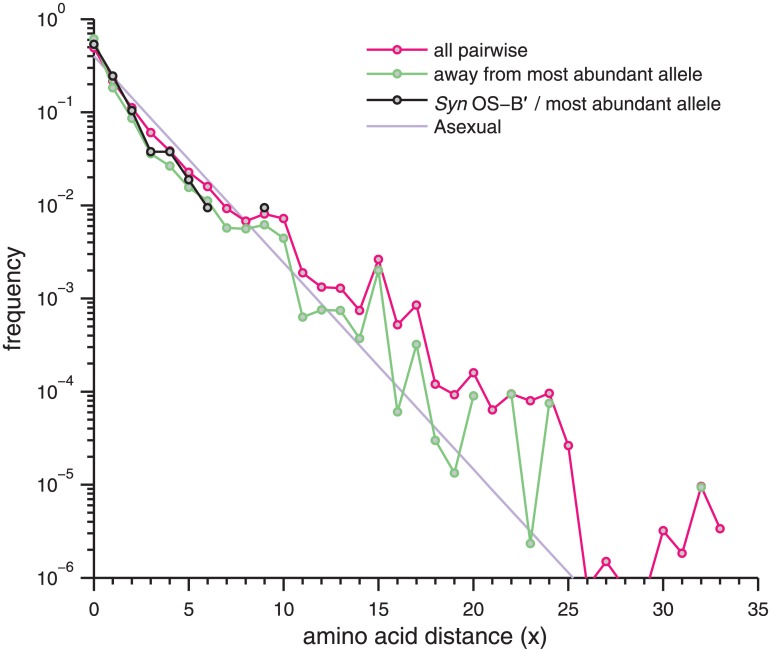
Fig 2. Pairwise distances between amino acid alleles.
The spectrum of pairwise distances x (magenta) and distances away from the most abundant allele (green) weighted by allele frequency over the amino acid alleles of the 106 deeply read loci with ≥ 50 amino acids (with indels excluded). The spectrum for each locus was computed independently, and then averaged together (although they are not quite comparable, due to the spread in the lengths of the coding sequences). A geometric distribution with (the expectation under asexual, neutral drift) is given in light purple, and the spectrum of distances from Syn OS-B′ to the most abundant is given in black.

