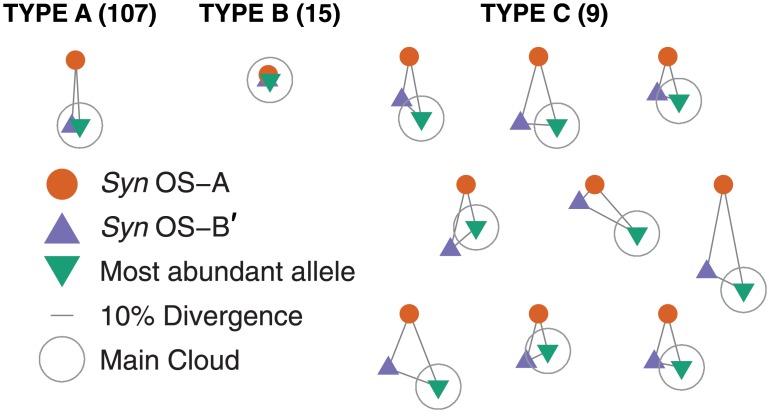
Fig 3. Triangles of Syn OS-A / Syn OS-B′ / most abundant allele distances.
From multiple alignment of the Syn OS-A, Syn OS-B′, and most abundant allele at each locus, we computed the distances (based on the percentage of columns in the alignment that differ) between each pair of these three alleles. We then formed triangles with edge lengths proportional to these distances for each of the (n = 135) deeply read loci. (Type A) representative of the typical pattern for which Syn OS-B′ is inside the main cloud (a 10% radius centered on the most abundant allele, shown by light gray circles) and Syn OS-A is outside the main cloud (n = 107, of which 91 have at least one read within 3% of Syn OS-A). (Type B) representative of the pattern in which both genomes are within the main cloud (n = 15). (Type C) those for which both genomes are outside the main cloud and also > 10% diverged from each other, with at least one amplicon read found nearby (< 3% divergence) to both genomes (n = 9). Thee were 4 triangles that matched none of these patterns: 1 was like Type C but had no read < 3% from Syn OS-A, 2 had Syn OS-A inside the main cloud and Syn OS-B′ outside it, and 1 had both genomes outside the main cloud but only 3.5% diverged from each other. Allele symbols and a scale bar are given in the lower left.

