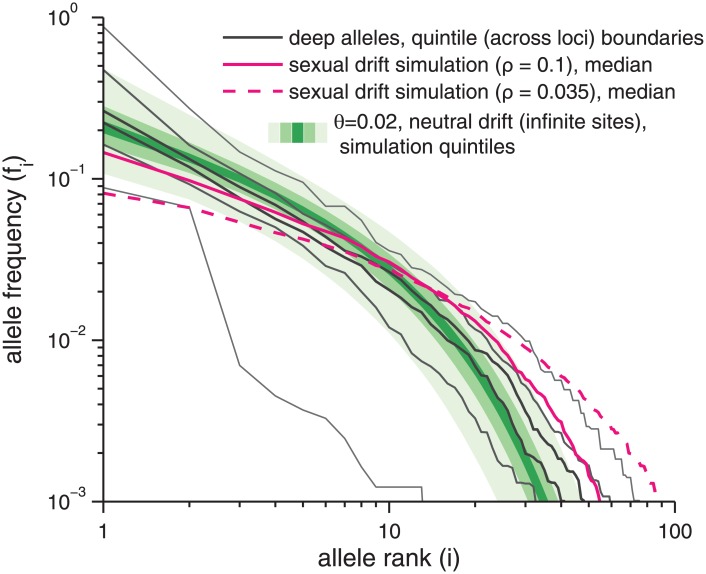
Fig 4. Allele rank-frequency spectrum.
The rank frequency spectrum of alleles at the 59 loci with ≥ 1000 reads. At each rank i, the black lines designate the quintile boundaries of {fi}, the frequencies of the ith most abundant alleles, across loci. The shades of green show simulated quintile boundaries over n = 1000 replicate simulations for the asexual infinite-sites neutral-drift model with θ = 0.02 per site. Magenta shows the median frequency at each rank across a simulated sexual data set with θ = 0.02 per site, population-scaled recombination rate per site ρ = 0.035 (solid, our earlier best estimate of the main cloud rate [18]) and ρ = 0.1 (dashed, an upper bound on the main cloud rate [18]), with coverages identical to those in the true data.

