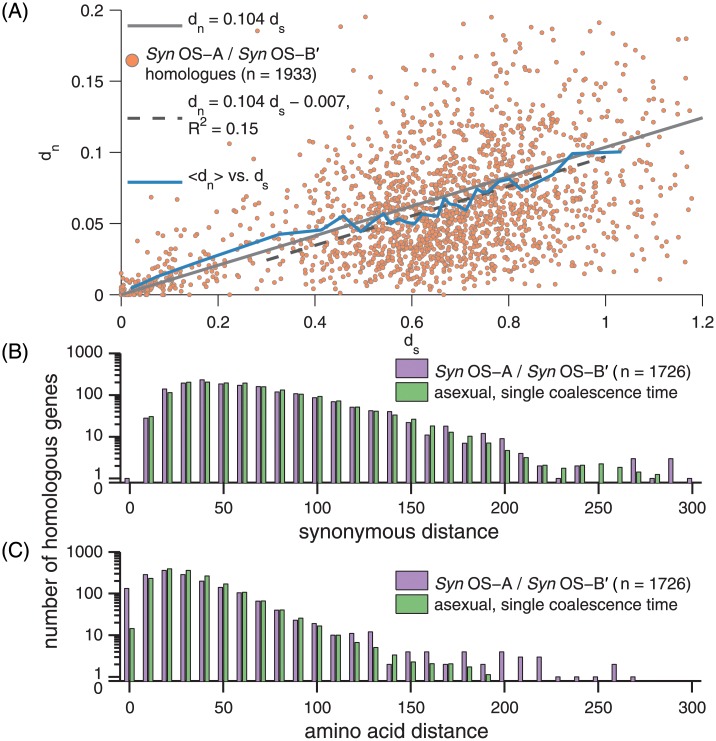
Fig 6. Syn OS-A /Syn OS-B′ divergence.
(A) The spectrum of synonymous, ds, and non-synonymous, dn, distances between Syn OS-A and Syn OS-B′ for their 1933 homologous genes (defined as reciprocal best BLAST hits with e-values < 1e − 100). In blue is a moving average of dn over windows of size 0.05 in ds. The genome-wide MLE ratio of dn/ds = 0.104 is shown (gray, from concatenating all loci together, see Methods), as well as the linear least squares fit of dn = 0.104ds − 0.007 for the 1726 well-diverged homologues with ds ≥ 0.3 (dashed black). (B-C) Histograms of the spectrum of synonymous (B) and non-synonymous (C) distances between the well-diverged homologues of Syn OS-A and Syn OS-B′. (B) Distribution (purple) of the number of conserved four-fold degenerate amino acids (A,G,P,T,V) with at least one synonymous SNP and the maximum likelihood distribution (green) under the assumption of asexual divergence with a single coalescence time, Tc with θs = 2Tcμ = 0.620 the probability for each four-fold degenerate codon to have mutated since the most recent common ancestor of Syn OS-A and Syn OS-B′. (C) Distribution of the amino acid distances (purple) and the maximum likelihood distribution (green) under the asexual single coalescence time model with θn = 0.113. Note the large excess over the null model at small distances.

