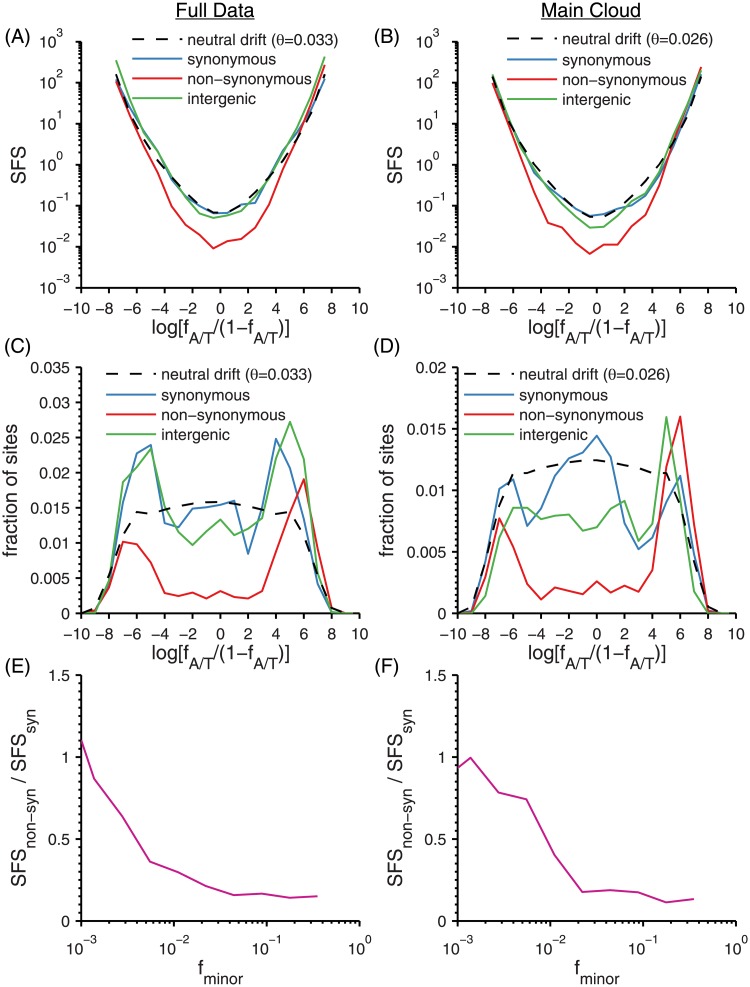
Fig 8. Transition site frequency spectra (SFS).
(A-D) Distributions of A/T frequencies fA/T of transition SNPs for synonymous (blue), non-synonymous (red), and intergenic (green) polymorphisms, together with equilibrium neutral drift prediction (black dashed) with θ inferred from the synonymous heterozygosity. (A,C,E) Full data and (B,D,F) Main cloud. (A,B) SFS vs. the log-transformed variable ℓ = log[fA/T/(1 − fA/T)]. (C,D) Histogram of ℓ without correcting for varying depth. In this ℓ-variable, the neutral drift distribution is roughly flat and equal to θ/2 at ℓ = 0 (corresponding to f = 1/2). The drop-offs at the two ends are due to the varying read depth. (E,F) Ratio of the non-synonymous to synonymous SFSs of transition SNPs vs. logarithm of the minor allele frequency, fminor = min(fA/T, fG/C). See Methods for details.

