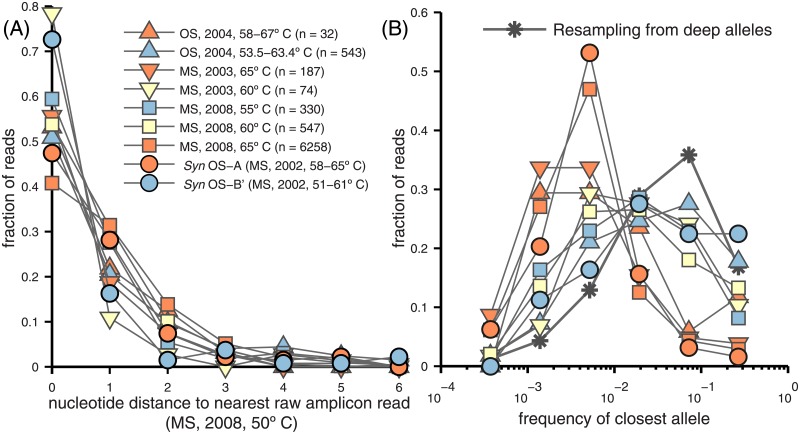
Fig 10. Comparisons between deep amplicon alleles and metagenome data, sequenced genomes, and higher-temperature amplicon data.
(A) Distributions of the number of substitutions to the nearest deep read from the high and low-temperature MS metagenome (downward triangle) and OS metagenome (upward triangle); from the two full genomes (circles), and from the high-temperature MS amplicon reads (squares). The temperatures of the data sets and the numbers of reads are given in the legend. Blue, yellow, and red correspond roughly to increasing temperature ranges, although the OS samples experience large fluctuations in temperature so these cannot be strictly compared. (B) Distribution of frequencies of the deep amplicon alleles that were identical to some read from the data sets shown in part (A). If the read from another data set is identical to a raw deep amplicon read but not an identified allele, it is assigned the frequency of the closest allele (from which the amplicon read had been presumed to be an error). The line with stars shows the frequency distribution that would be found if the deep amplicon data sample were resampled, i.e. alleles drawn randomly with probability proportional to their observed frequency. The x coordinates are the left edges of each half-log-sized bin.

