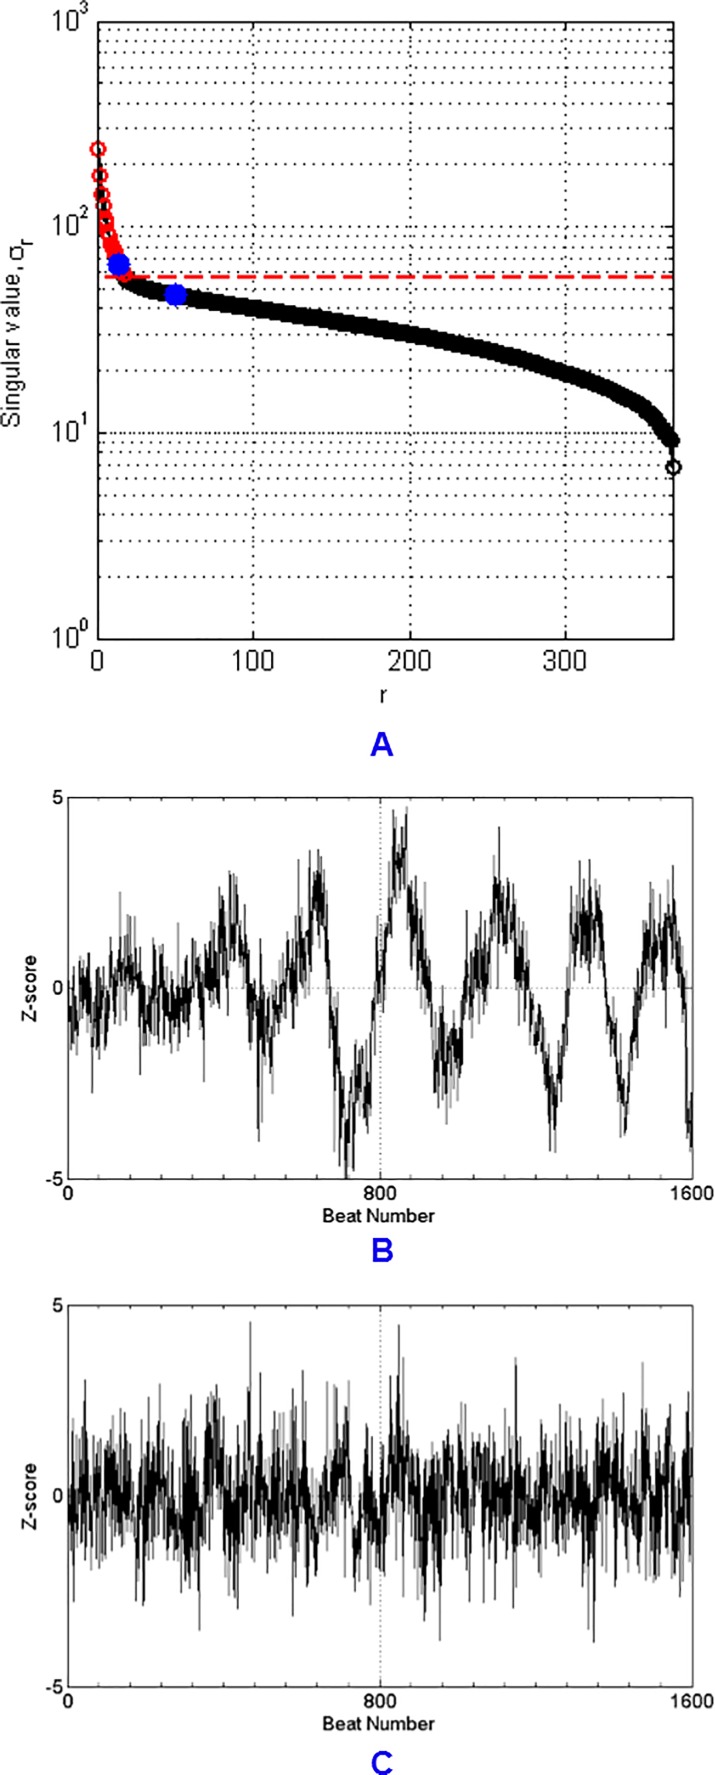
Fig 1. Plots of singular values and the principal components (PCs).
(A) Plot of singular values with the optimal hard threshold found by the method proposed by Gavish and Donoho.27 The singular values that are above the threshold are plotted in red while the ones that are below the threshold are plotted in black. The blue dot above the red dash line corresponds to the 14th singular value. The blue dot below the red dash line corresponds to the 50th singular value. (B) PC 14. (C) PC 50.

