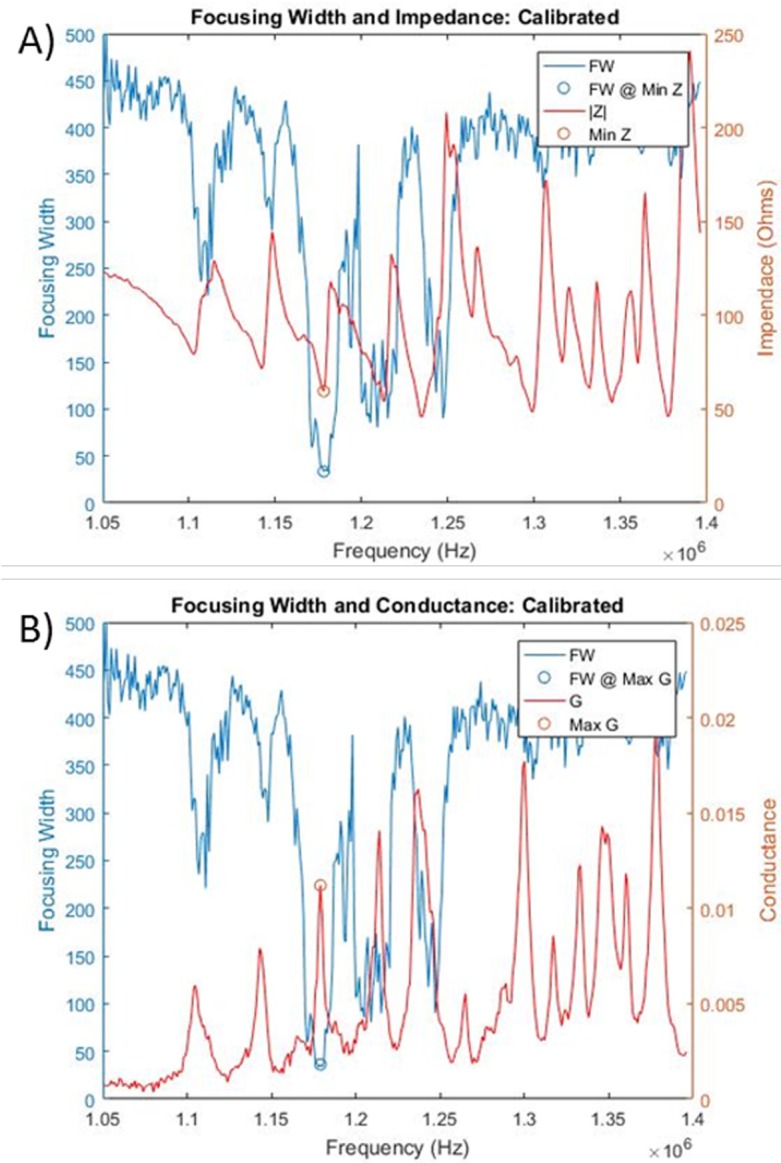
Fig 10. Focusing width and conductance in Si system.

Calibrated impedance (A) and conductance (B) scans are shown overlaid with acoustic focusing width. A local conductance max (impedance minima) was correlated with the best performing driving frequency (1.179 MHz). The overlaid blue and red circles were selected from the focusing data alone, demonstrating near perfect correlation between the conductance maxima and focusing minima. Note that there were additional conductance peaks that could otherwise be indistinguishable from the optimal frequency if the search bandwidth was not limited.
