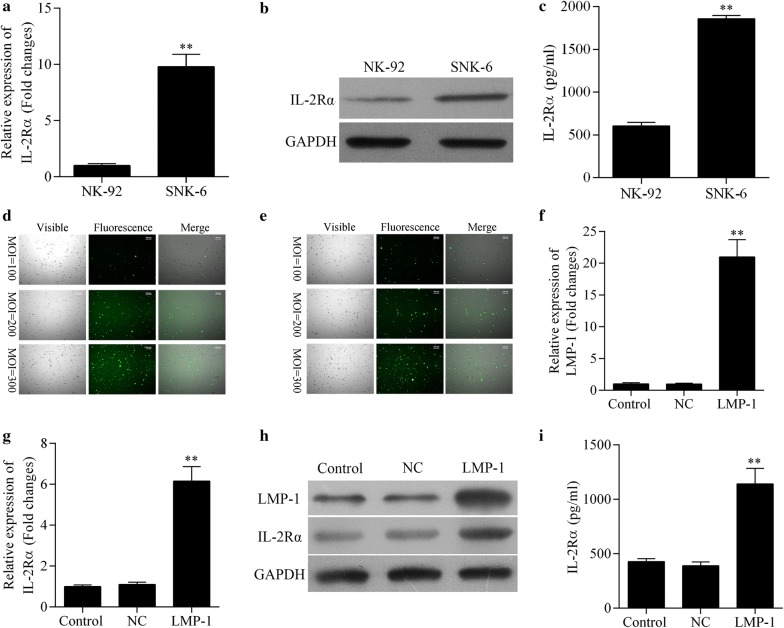
Fig. 1.
a–c Analysis of NK-92 and SNK-6 cell lines in terms of levels of a IL-2Rα mRNA by quantitative real-time PCR, b IL-2Rα protein by Western blot, and c soluble IL-2Rα protein in culture supernatant by ELISA. **P < 0.01 vs NK-92 cells. d, e Efficiency of NK-92 cell infection with d lentivirus encoding LMP1 or e negative control lentivirus at multiplicities of infection (MOIs) 100, 200, or 300. f–i Analysis of NK-92 cells (control) and NK-92 cells transduced with lentivirus encoding LMP1 (LMP1) or negative control lentivirus (NC) in terms of levels of f LMP1 and g IL-2Rα mRNA by quantitative real-time PCR, h LMP1 and IL-2Rα proteins by Western blot, and i soluble IL-2Rα protein in culture supernatant by ELISA. **P < 0.01 vs control or NC

