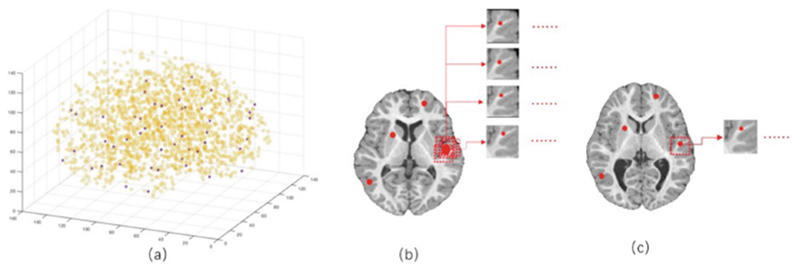
Fig. 3.

Illustration of landmarks selection and patch extraction. The yellow color in a is the illustration of all identified anatomical landmarks, and the red points show the selected 50 landmarks which are chosen by both their p-values and spatial distances from other nearby points. b shows 4 randomly extracted patches around a landmark which are as ASD training samples, and c shows 1 randomly extracted patch which is used as NC training sample.
