
Figure 5.
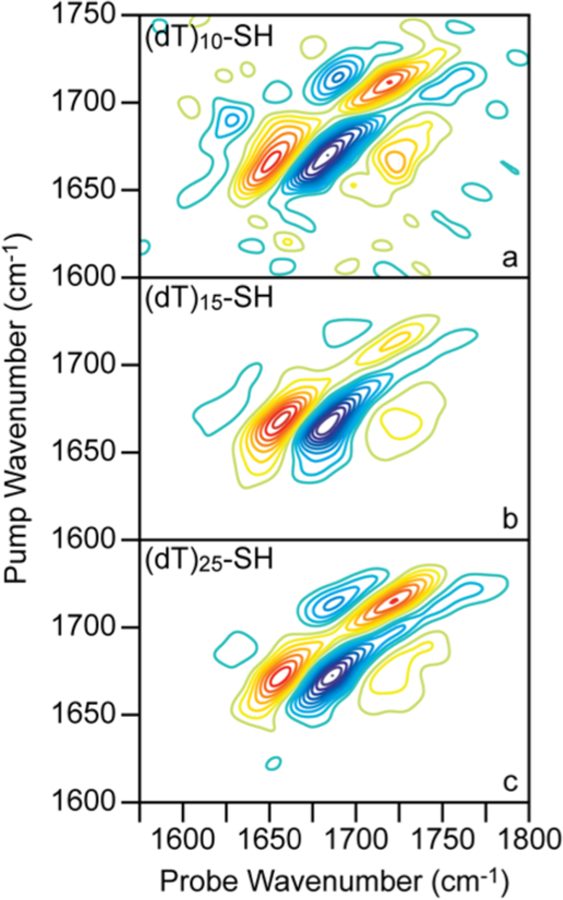
2D SFG spectra of (dT)10-SH, (dT)15-SH, and (dT)25-SH monolayers on gold. 2D SFG spectra at t2 = 0 fs for (a) (dT)10-SH, (b) (dT)15-SH, and (c) (dT)25-SH. All spectra are normalized to the most intense peak and plotted from −1 to +1 with contour steps of 10%. Zero level contours are omitted002E