
Figure 6.
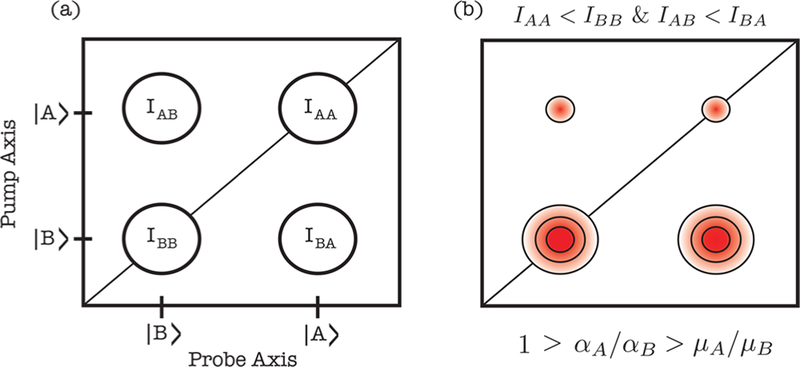
Simplified 2D SFG spectrum with two modes A and B. (a) Fundamental peaks of a two mode system. (b) The asymmetric peak pattern matches our experimental observation. The equation below is one of the conditions for this asymmetric pattern.
Official websites use .gov
A
.gov website belongs to an official
government organization in the United States.
Secure .gov websites use HTTPS
A lock (
) or https:// means you've safely
connected to the .gov website. Share sensitive
information only on official, secure websites.
Simplified 2D SFG spectrum with two modes A and B. (a) Fundamental peaks of a two mode system. (b) The asymmetric peak pattern matches our experimental observation. The equation below is one of the conditions for this asymmetric pattern.