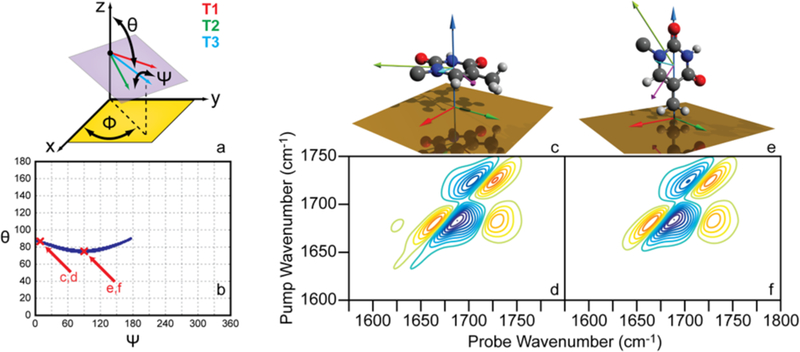
Figure 7.

Simulated 2D SFG spectra of an uncoupled single thymine base. (a) Coordinate system for the single thymine base scan. The thymine base plane is represented by the purple surface with T1 (red), T2 (green), and T3 (blue) vectors shown. (b) Orientation (ψ,θ) plot with configurations that produce simulated 2D SFG spectra within the outlined criteria shown as blue dots. The two positions marked with red cross marks correspond to the orientations and spectra shown in Figure 6c, d and Figure 6e, f, respectively. (c) Thymine base in (ψ = 10°, θ = 86°) conformation, and (d) corresponding simulated 2D SFG spectrum. (e) Thymine base in (ψ = 90°, θ = 75°) conformation, and (f) corresponding simulated 2D SFG spectrum.
