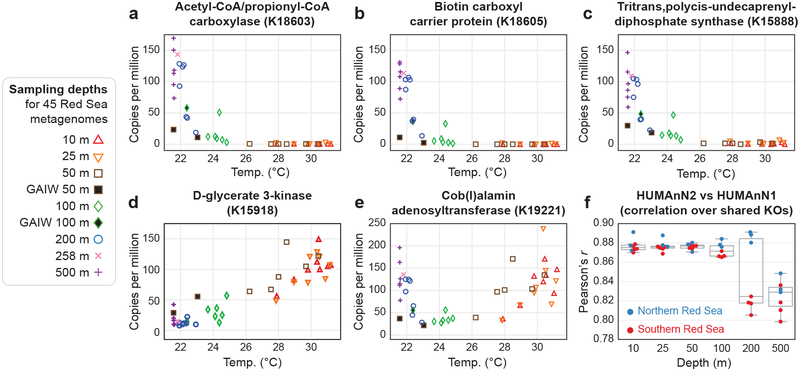
Figure 3: Thermocline-associated microbial enzymes in the marine pelagic zone.
(a-e) Examples of KEGG Orthogroups (KOs) demonstrating strong temperature associations across 45 Red Sea metagenomes; all were newly quantified by HUMAnN2 relative to the samples’ initial publication. (f) Pearson correlations for 4,609 KOs that were quantified by both HUMAnN2 and HUMAnN1. “GAIW” indicates “Gulf of Aden Intermediate Water”: a cool nutrient-rich water mass within the Red Sea. The n=45 total samples in (f) are subdivided by depth layers (the sample from 258 m was grouped with the 500-m samples) and colored by latitude. From smallest to largest, box plot elements represent the lower inner fence, first quartile, median, third quartile, and upper inner fence.

