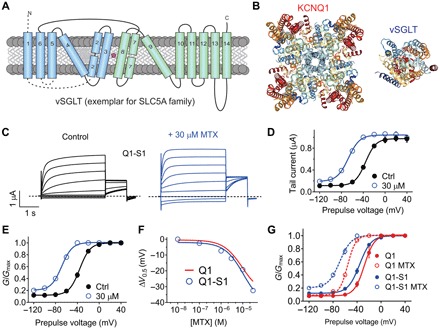
Fig. 4. Summation of effects of MTX and SMIT1 on KCNQ1 activation.

All error bars indicate SEM. (A) Topology of vSGLT, a eukaryotic SLC5A family ortholog bearing predicted structural similarity to SMIT1. (B) High-resolution structures of KCNQ1 and vSGLT (extracellular view) to illustrate relative sizes. (C) Averaged KCNQ1-SMIT1 traces in the absence (control) or presence of 30 μM MTX (n = 5). Dashed line indicates zero current level. (D) Mean effects of 30 μM MTX on KCNQ1-SMIT1 raw tail currents at −30 mV after prepulses as indicated [as in (C); n = 5]. (E) Mean effects of 30 μM MTX on KCNQ1-SMIT1 G/Gmax calculated from tail currents at −30 mV after prepulses as indicated [as in (C); n = 5]. (F) MTX dose response for mean ΔV0.5 of activation of KCNQ1-SMIT1 (blue) and KCNQ1 (red) (n = 5 to 7). (G) Comparison of mean effects of 30 μM MTX on KCNQ1 (red) and KCNQ1-SMIT1 (blue) G/Gmax calculated from tail currents at −30 mV after prepulses as indicated [as in (C); n = 5 to 7].
