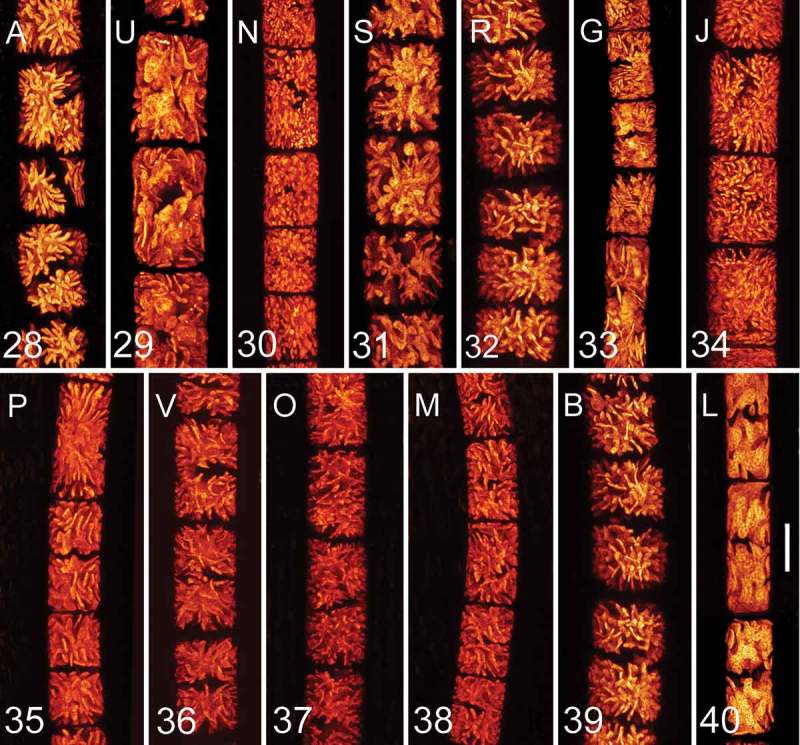
Figs 28–40.

Confocal laser scanning microscopy of young vegetative cells of the investigated genotypes. Fig. 28. Genotype A; Fig. 29. U; Fig. 30. N; Fig. 31. S; Fig. 32. R; Fig. 33. G; Fig. 34. J; Fig. 35. P; Fig. 36. V; Fig. 37. O; Fig. 38. M; Fig. 39. B; Fig. 40. L. Scale bar = 20 µm in all images. Genotypes are ordered according to phylogeny described in Fig. 2.
