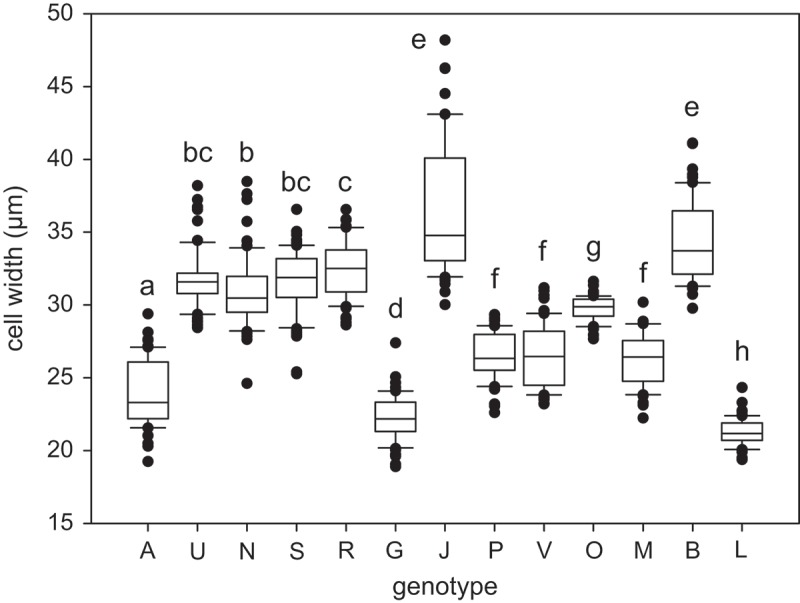
Fig. 41.

Cell width of all investigated genotypes (n = 60). The line within the box marks the median, boundaries indicate the 25th and 75th percentiles, error bars indicate the 10th and 90th percentiles, and individual points denote outliers (samples with values outside this range). Genotypes that do not significantly differ from each other share at least one letter, while those significantly different from each other do not share any letters (p < 0.05; Kruskal–Wallis test with multiple comparisons).
