. 2018 Oct 3;7:e38683. doi: 10.7554/eLife.38683

Figure 4. Csa1 and Csa2 as the key targets of Pum1 are required for post-meiotic sporulation.

(A) Enrichment of genes belonging to different signaling cascades in four gene groups. Among these mating cascades, only the set of genes activated by Pum1 was specifically enriched in group II. Genes used for the enrichment assessment include those encoding the published components (mating MAPK pathway) or the genes activated by the activators (Znf2, Mat2 and Pum1) dominating different sexual stages (Figure 4—source data 2). Genes activated by Mat2 and Znf2 (‘Mat2-activated genes’ and ‘Znf2-activated genes’) are derived from the previous transcriptome data (Lin et al., 2010). The gene set ‘Pum1-activated genes’ is generated based on the RNA-seq analysis of the PUM1 overexpression strain (Supplementary file 2). Only significantly enriched (p<0.001, Fisher’s exact test) families are colored. (B) Enriched GO terms of 94 group II genes induced by Pum1 using BiNGO. (C) Dynamic expression of the group II regulators with predicted RNA-binding or DNA-binding domains, whose mRNA levels were induced upon Pum1 overexpression, during unisexual reproduction. (D) Mating phenotypes for wild type XL280 and its isogenic mutant strains. Phenotype scores are represented in distinct colors based on quantitative or semi-quantitative analysis targeting the phenotypes related to sequential differentiation events during unisexual cycle. The results represent experiments from at least three independent mutants. (E) Sporulation phenotypes for XL280 (wild-type) and different Pum1 downstream regulator mutants during unisexual mating. Scale bar: 20 μm.

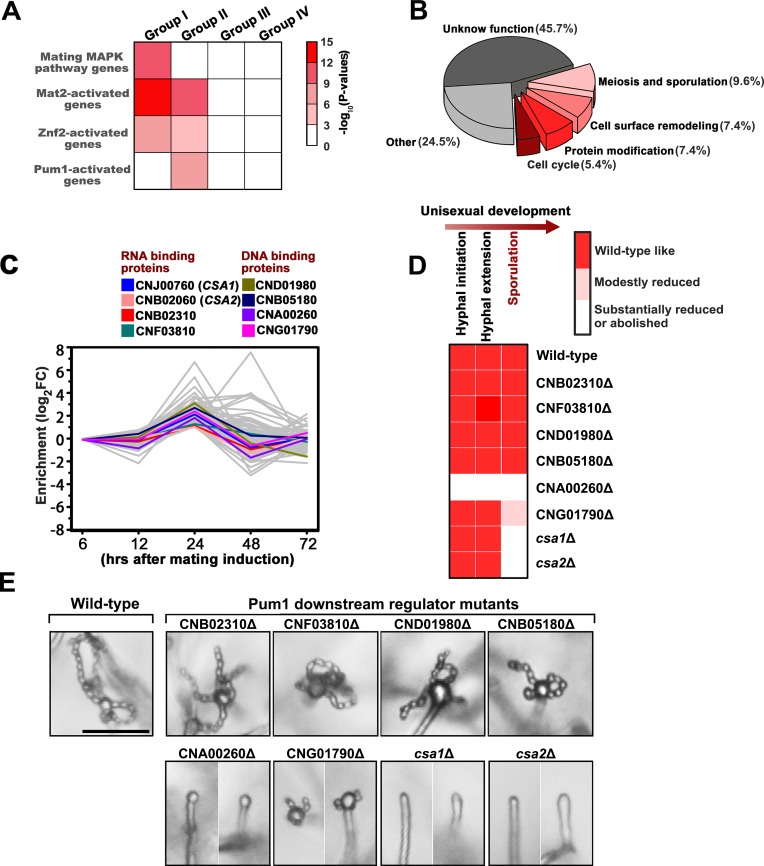
Figure 4—source data 1. Source file for Figure 4C.
The regulatory genes belonging to gene group II.
elife-38683-fig4-data1.xlsx (717.4KB, xlsx)
DOI: 10.7554/eLife.38683.016
Figure 4—source data 2. Source file for Figure 4A.
Enrichment of the genes belonging to different signaling cascades in four gene groups.
DOI: 10.7554/eLife.38683.017

Figure 4.

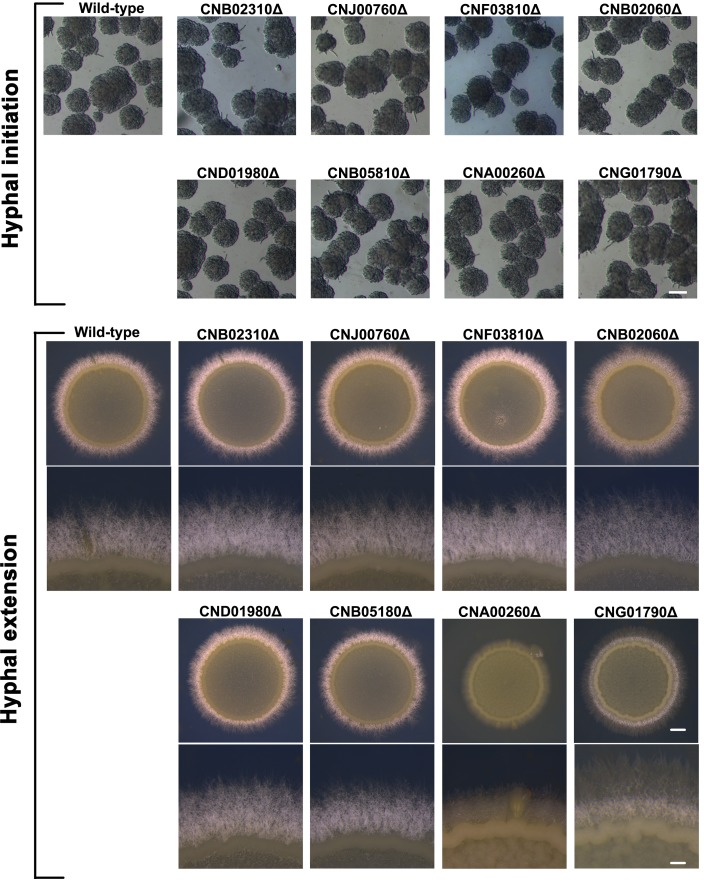
Figure 4—figure supplement 1. Mating phenotypes of the mutants lacking the regulators downstream of Pum1, including hyphal initiation and hyphal extension.

Figure 4—figure supplement 1.

Scale bars: 100 μm (hyphal initiation); 1 mm (hyphal extension, upper panels) and 200 μm (hyphal extension, bottom panels).
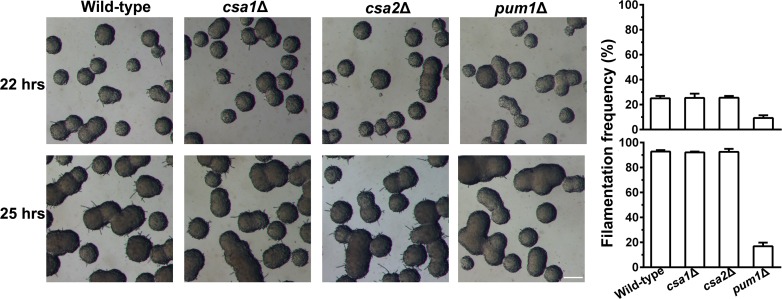
Figure 4—figure supplement 2. The absence of Pum1 but not its downstream targets Csa1 and Csa2 adversely affected self-filamentation during unisexual reproduction.

Figure 4—figure supplement 2.

For quantitative analysis of self-filamentation frequency during unisex, the cells of each strain were plated onto V8 medium at a low cell density and allowed to grow into isolated mini-colonies after 22 hr or 25 hr of culture. Mini-colonies exhibited a great heterogeneity in filamentation (left), and filamentous incidence among mini-colonies reflects the strength of unisexual induction. Filamentation frequency (FF) is the percentage of filamentous mini-colonies. The dynamics in FF during unisexual development in different strains was calculated, respectively (right). n = 3 independent experiments, mean ± SD. Scale bar: 100 μm.
Figure 4—figure supplement 2—source data 1. Source file for Figure 1—figure supplement 1.
DOI: 10.7554/eLife.38683.015