
Figure 1. Shear induced inward/outward oscillations in cells in the y-direction and cell movements opposite to the shear in the x-direction.
(A) Shear (100 μm) was applied to a MDCK monolayer adhering to the device planks (Supplementary Materials). (B) PIV was used to quantify the x- and y-direction velocities (green arrows) of MDCK cells expressing E-cadherin:DsRed over time. (C) Symmetric PIV data were averaged by ‘folding’ over the shear-plane. The color map displays the speeds of cell movement in the outward/inward (blue/red) y-direction relative to the shear-plane (0 μm y Pos.), or in the opposite/with x-direction relative to the shear direction (blue/red, 30 μm/h). (D, F, H, J) y- (D and H) and x-velocity (F and J) kymographs from three independent experiments with 15 min binning of three 5 min PIV data of cell movements with (D and F, dashed black line) or without (H and J) shear over 20 h. (E, G, I, K) y- (E and I) and x-direction (G and K) cell movements based on numerical integration of y- and x-velocity kymographs over time, respectively, at positions 8, 50, 100, 150, 200, and 242 μm from the shear-plane (Figure 1—figure supplement 7). Insets provide greater spatial resolution of movement in the deformation zone (G and K, insets).

Figure 1—figure supplement 1. A silicon device for force sensing and the application of in-plane shear to a cell monolayer.

Figure 1—figure supplement 2. MDCK E-cadherin:DsRed cell monolayers before and after shear plus tension show the monolayer remains intact.

Figure 1—figure supplement 3. MDCK E-cadherin:DsRed cell monolayers before and after shear show deformation localized to the shear plane.

Figure 1—figure supplement 4. Cell orientation, eccentricity, area, density, and perimeter over time after shear did not match the periodicity of y-direction oscillations.

Figure 1—figure supplement 5. High-magnification of MDCK E-cadherin:DsRed cells at the shear plane shows no change in E-cadherin asymmetry or recruitment upon shear.
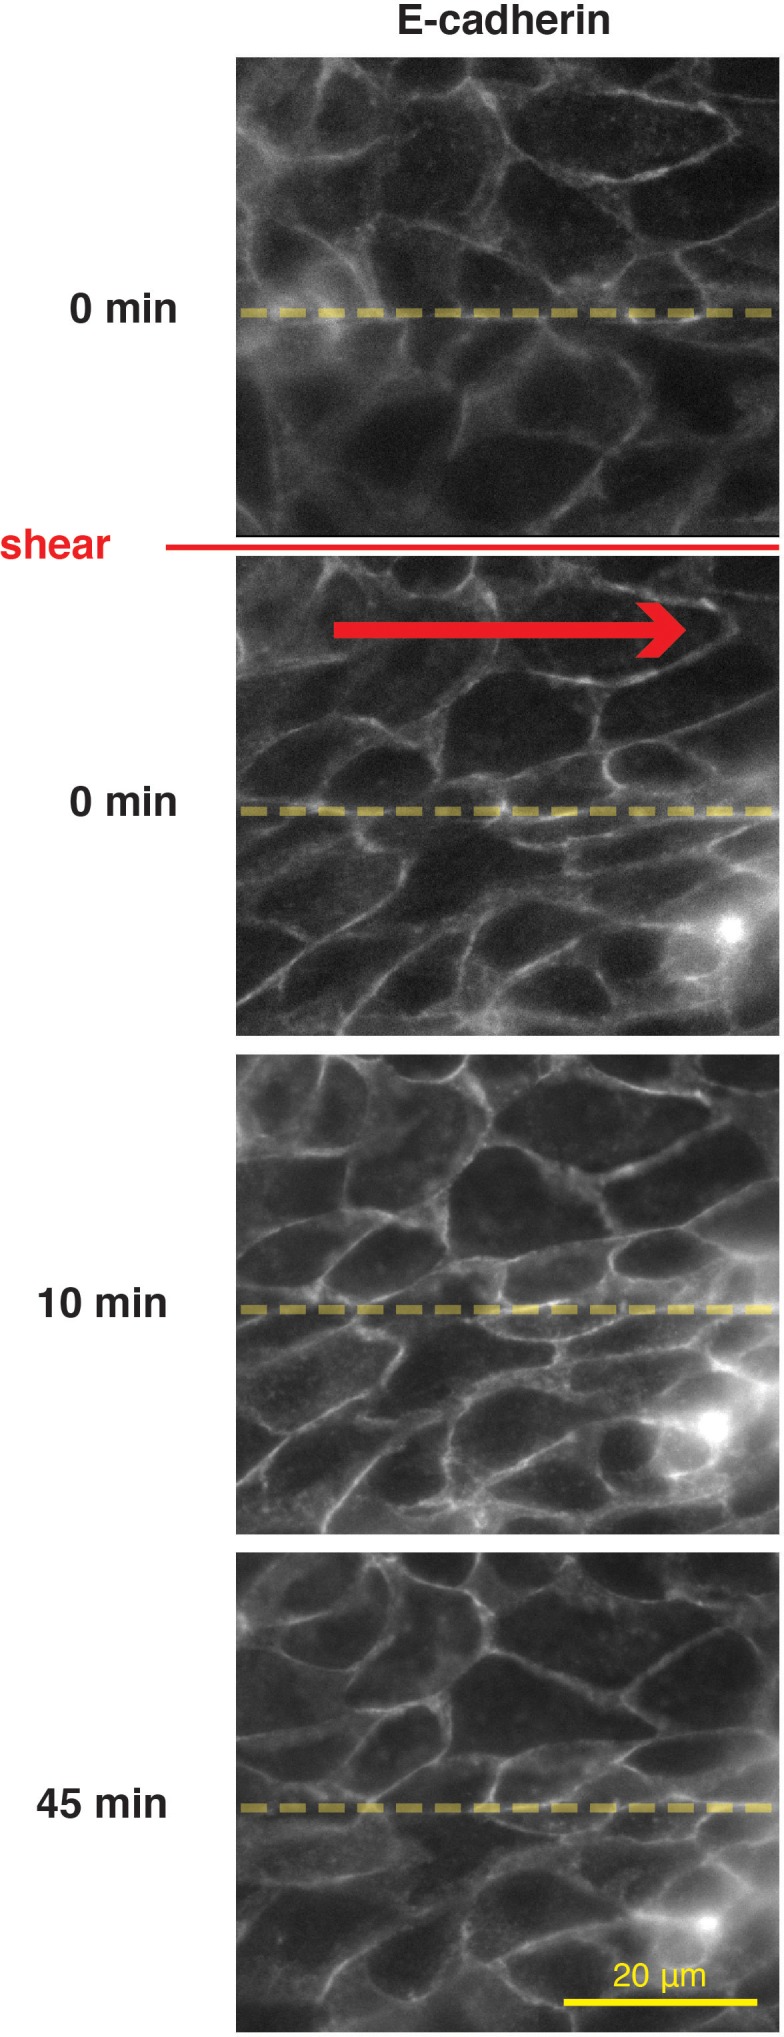
Figure 1—figure supplement 6. Density of MDCK cells without shear was similar to their density with shear.

Figure 1—figure supplement 7. Velocity kymographs and cell-displacement plots generated from PIV data.
