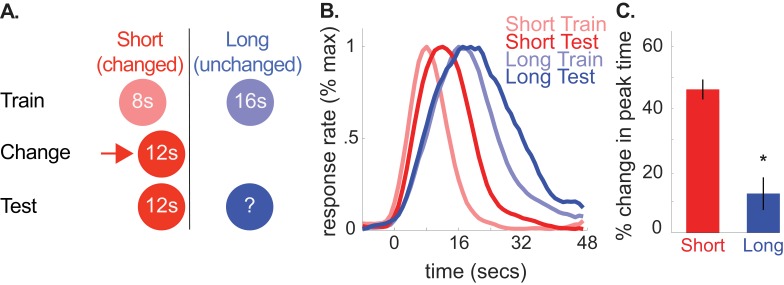
Figure 3. A shows the design used in the 8-to-12 group of the second experiment (n = 10).
(B) shows normalized responding during training and the test phases. (C) shows percent change in peak time for each cue during testing (±SEM), relative to initial training. Stars indicate significance.

