. 2018 Nov 2;7:e38790. doi: 10.7554/eLife.38790

Figure 5. Top panels of A and B show designs used for the correlated (n = 5) and uncorrelated (n = 5) groups of Experiment 4a, respectively.

Mean normalized response rate for the critical, medium cue during initial training and testing are plotted in the corresponding bottom panels. (C) shows percent change in peak times for all cues in each group during testing (±SEM).

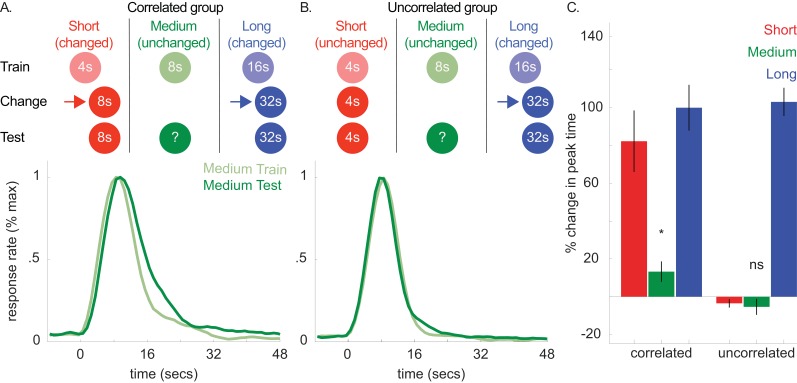
Figure 5—source data 1. Data used to generate Figure 5.
DOI: 10.7554/eLife.38790.022

Figure 5.

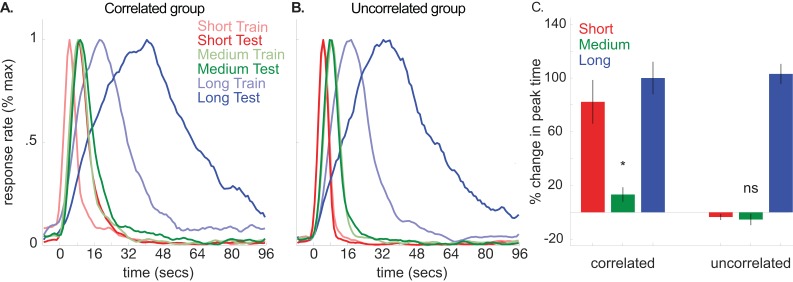
Figure 5—figure supplement 1. A and B show probe trial responding during initial training and testing for each cue in the correlated (n = 5) and uncorrelated (n = 5) groups of Experiment 4a, respectively.

Figure 5—figure supplement 1.

(C) shows percent change in peak time at test (±SEM) for both groups and all cues, relative to initial training.
Figure 5—figure supplement 1—source data 1. Data used to generate Figure 5—figure supplement 1.
DOI: 10.7554/eLife.38790.021