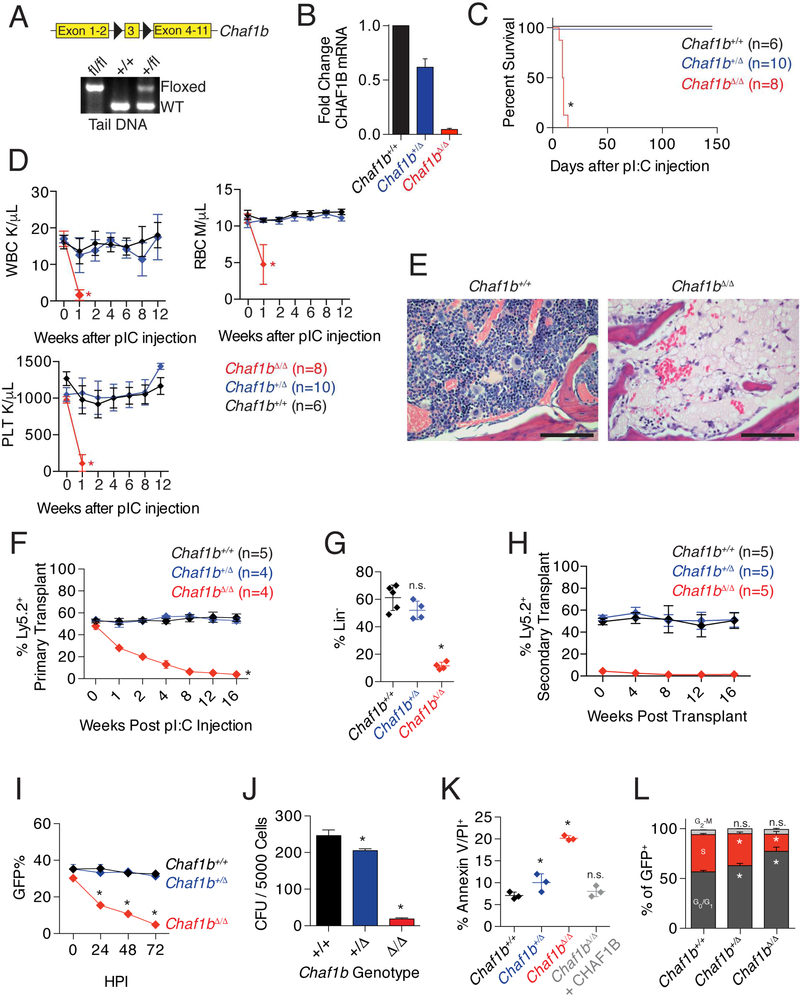
Figure 1: Chaf1b is required for hematopoiesis.
(A) Schematic of the floxed allele of Chaf1b and genotype confirmation in tail DNA. (B) qPCR of CHAF1B transcription in HSPCs after infection with MIGR1-Cre. (C) Survival curve of Mx1-Cre wild-type, Chaf1b heterozygous or Chaf1b homozygous floxed mice following pIpC treatment. (D) Peripheral blood white cells (WBC), red blood cells (RBC), and platelet counts (PLT). (E) Sternum bone marrow H&E stain 10 days following pIpC injection. Pictures are representative of three independent trials, scale bars represent 250 μm. (F) Contribution of Chaf1b wild-type, heterozygous and homozygous deficient cells to the peripheral blood following 1:1 competitive transplant. (G) Ly5.2 donor cell contribution to the bone marrow 4 months after transplant. (H) Contribution of Chaf1b wildtype, heterozygous and homozygous deficient cells to the peripheral blood of secondary transplant recipients. (I) In vitro competitive growth assay of HSPCs following introduction of Cre. (J) HSPC colony formation assay following in vitro deletion of Chaf1b. (K) Cell death following Chaf1b deletion by MIGR1-Cre. L) Cell cycle analysis of Chaf1b targeted cells by EdU/DAPI staining of HSPCs 72 hours post transduction. * indicates statistical significance (p<0.05) as determined by log-rank test (C), one-way ANOVA with Bonferroni correction (D, F-L). Results shown are representative of three independent biological replicates (E), are depicted as mean +/− SD from three independent biological replicates (B, I, J, L), are mean +/− SD from indicated numbers of mice (D, F, H), or mean +/− SD from 3–5 mice with points representing individual mice (G, K). See also Figures S1 and S2.

