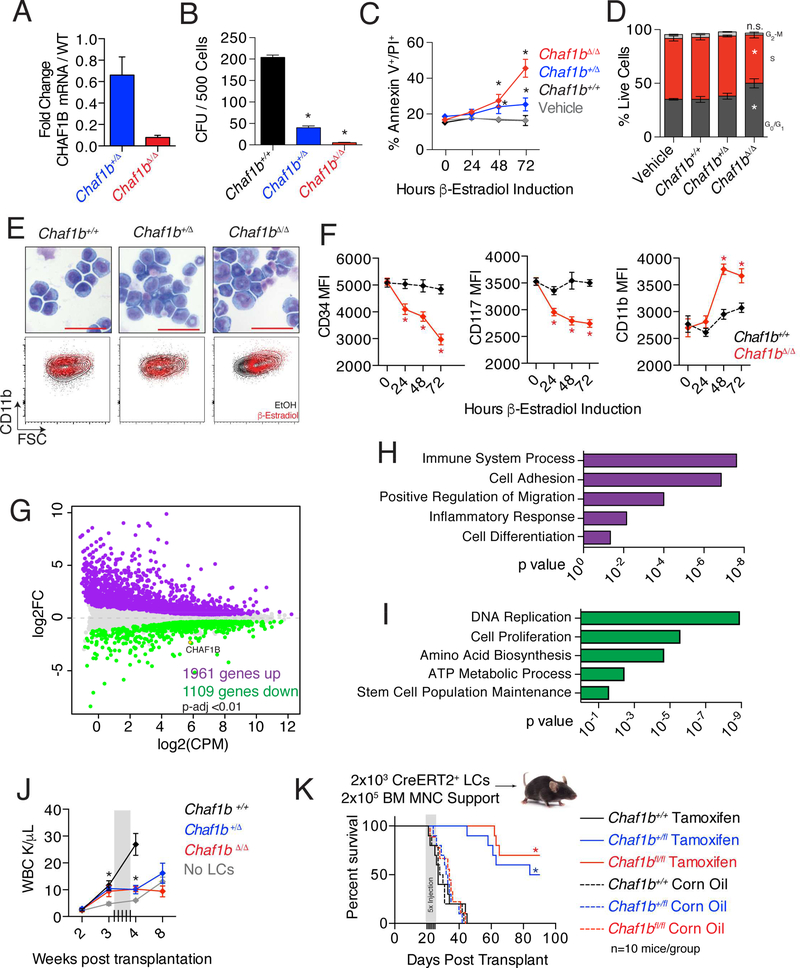
Figure 4: Loss of Chaf1b induces differentiation of MLL-AF9 leukemic cells.
(A) qRT-PCR analysis of MLL-AF9 leukemic cells (LCs) with CreERT2 for Chaf1b mRNA expression after Cre induction with estradiol. (B) Colony forming unit assay with CreERT2 MLL-AF9 LCs 24 hours after induction of Chaf1b deletion. (C) Annexin V/PI stain of LCs after Cre induction with estradiol. (D) Cell cycle analysis of LCs 72 hours after Cre induction with estradiol. (E) WrightGiemsa stain of leukemic cells 72 hours following Chaf1b deletion. Scale bar indicates 50 μm. Representative FACS plots (FSC vs CD11b) of each condition are shown beneath the images. (F) Mean fluorescence intensity of CD34, CD117 and CD11b in leukemic cells following Chaf1b deletion. (G) MDS plot showing genes with significantly (p<0.01) altered expression 48 hours after Chaf1b deletion. (H, I) GO Pathway analysis of genes that are increased (H) or decreased (I) 48 hours following Chaf1b deletion in leukemic cells. (J) Peripheral circulating leukocyte counts measured by complete blood count. Gray box indicates dated of tamoxifen injections. (K) Survival of recipient mice following injection with tamoxifen (solid lines) or vehicle (dotted lines). * indicates statistical significance (p<0.05) as determined by One-way ANOVA with Bonferroni’s correction (A-D, F, J), or log-rank test (K). Unless otherwise indicated, results shown are representative of three independent biological replicates. Bar graphs depict mean +/− SD. See also Figure S4.

