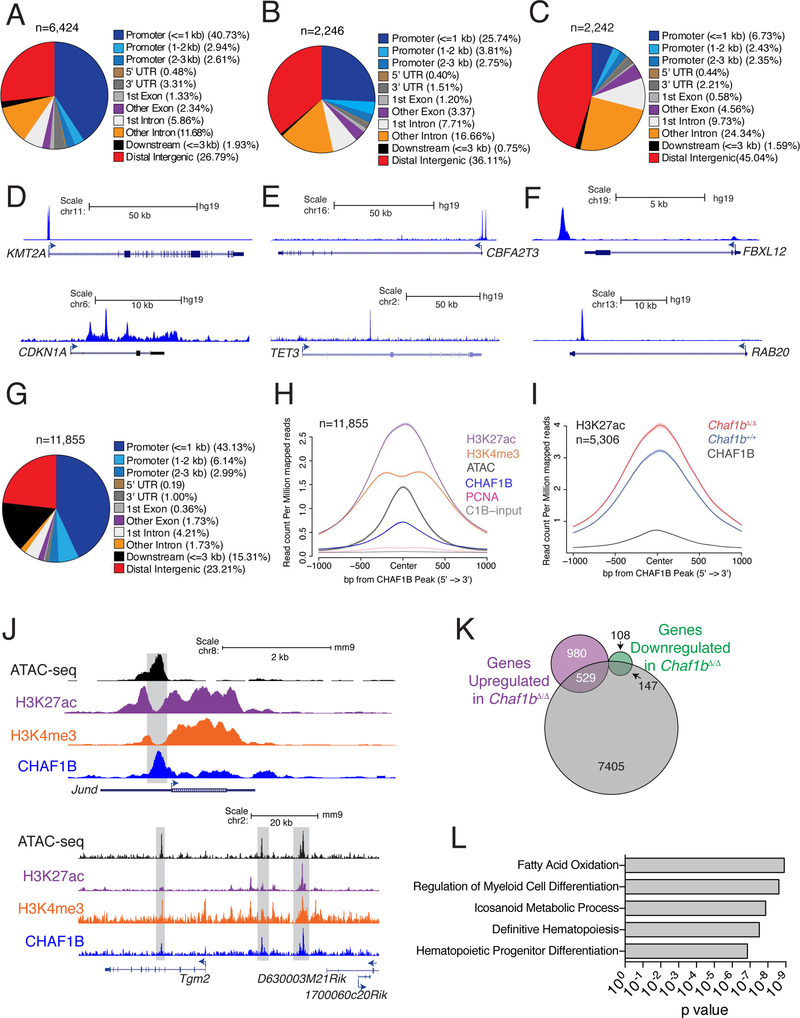
Figure 5: CHAF1B accumulates at discrete sites in the chromatin of leukemic cells.
(A-C) Distribution of CHAF1B peaks in MOLM13 (A), U937 (B), and JURKAT (C). (D-F) Track examples of CHAF1B occupancy in MOLM13 (D), U937 (E), and JURKAT (F). (G) Distribution of CHAF1B occupancy in MLL-AF9 leukemia cells. (H) Meta-analysis of ATAC-seq, H3K4me3, H3K27ac, PCNA, and input peaks localized to CHAF1B peaks in MLL-AF9 LCs. (I) Meta-analysis of H3K27ac peaks that increase at CHAF1B occupied sites before and after Chaf1b deletion. (J) Track examples of Jund and Tgm2. Gray boxes indicate areas of interest. (K) Venn diagram of unique genes with discrete CHAF1B peaks compared to genes upregulated or downregulated 48 hours after Chaf1b deletion. (L) GREAT analysis of genes and pathways localized near peaks determined in (K). See also Figure S5.

