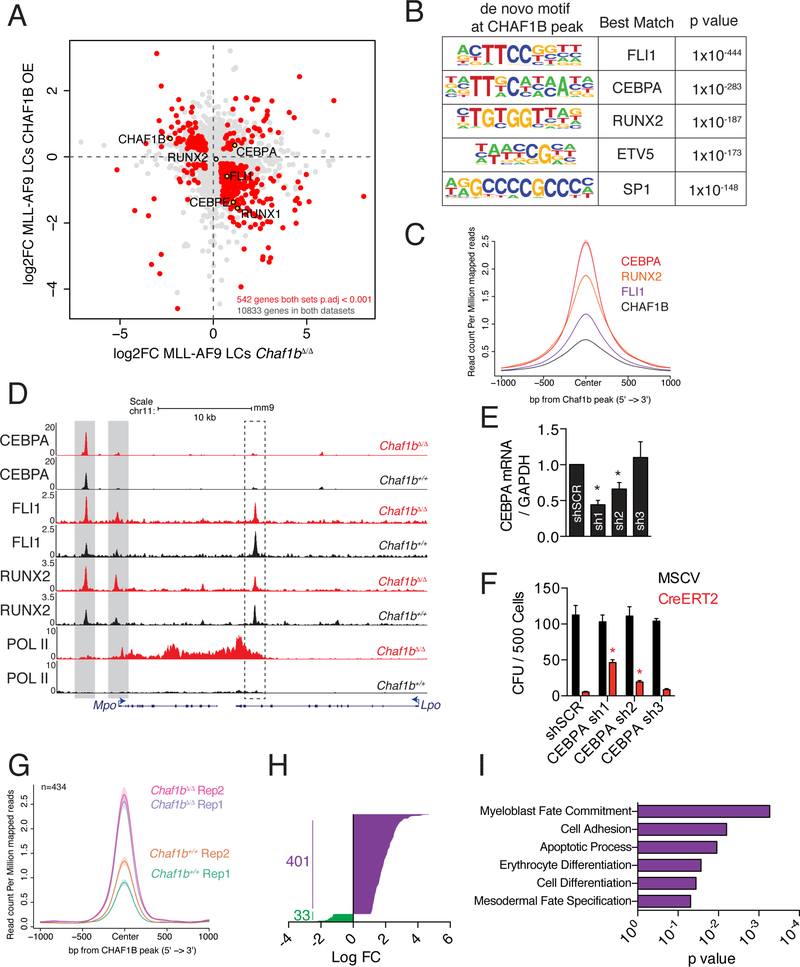
Figure 6: CHAF1B interferes with CEBPA to drive differentiation in leukemic cells.
(A) RNA-seq analysis in leukemic cells overexpressing CHAF1B or deleted for Chaf1b. (B) De novo motif analysis of DNA bound by CHAF1B peaks. (C) Metaplot of CEBPA, RUNX2, and FLI1 occupancy centered on CHAF1B peaks as determined by ChIP-seq in MLL-AF9 LCs. (D) Track example of Mpo and Lpo. Gray/dashed boxes indicate regions of interest in Mpo/Lpo respectively. (E) CEBPA mRNA levels after shRNA knockdown in LCs as measured by qRT-PCR. (F) Colony assay in leukemic cells with CEBPA shRNA following Chaf1b homozygous deletion by CreERT2. (G) Metaplot of significantly altered CEBPA peaks before and after Chaf1b deletion centered on CHAF1B peaks. (H) Log fold change in significantly altered CEBPA peaks. (I) Gene ontology analysis based on the nearest TSS to peaks identified in G and H. * indicates p<0.01 as determined by one-way ANOVA with Bonferroni’s correction. Results shown are mean +/− SD in E and F. C is a compilation of two biological replicates. Individual replicates are shown in G. See also Figures S6 and S7.

