
Fig. 4.
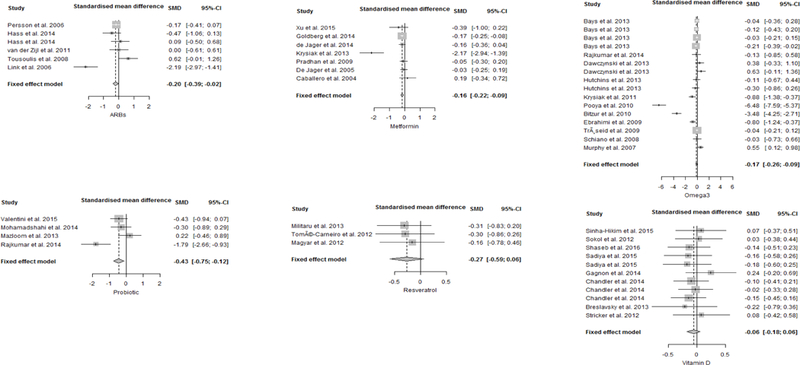
Forest plots for effect of interventions compared to placebo group on CRP levels. A standardized difference in means <0 favours intervention and >0 favours the placebo arm. Box size represents study weighing. Diamond represents overall effect size and 95% confidence intervals.