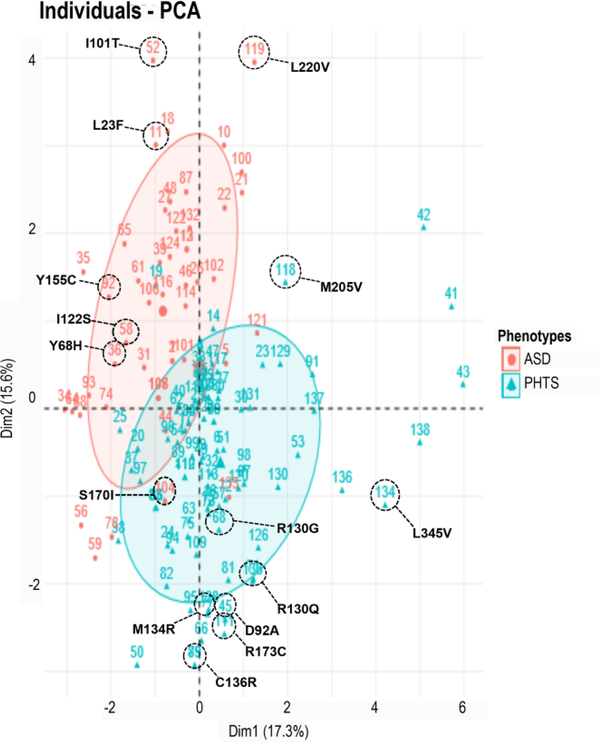
Figure 1.
Principal component analysis (PCA) multivariate plot segregates ASD- vs. cancer-associated mutations. PCA performed on patient data using predictive genotypic and phenotypic variables including clinical phenotypes, pathogenicity predictors, other genotype information, and structural stability predictors. PCA of the first two axes explains 15.6% and 17.3% of the variation (32.9% total). Projection along the two axes is represented by a red ellipse (ASD) in the upper left quadrant and a blue ellipse (cancer) in the lower right quadrant. Red circle points correspond to ASD phenotype, whereas blue triangle points designate PHTS cancer-associated phenotype.

