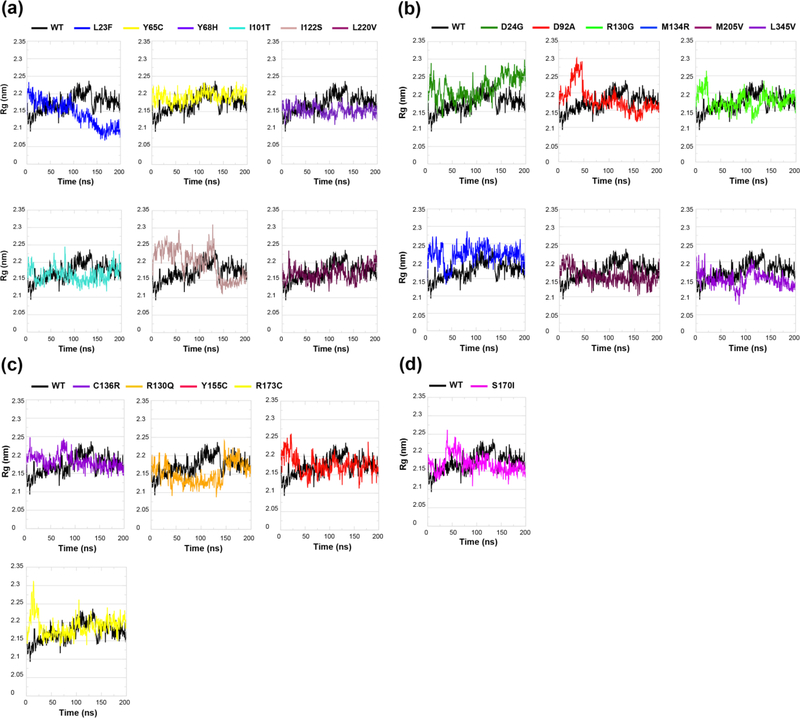
Figure 6.
Structural folding/unfolding behavior of PTEN in ASD- vs. cancer-associated mutations. Time course of backbone radius of gyration (Rg) of (a) ASD (only), (b) cancer (only), (c) mutations shared across both phenotypes, and (d) one mutation with coexisting phenotypes in comparison to WT PTEN. Solid black line is the WT PTEN structure with the colored line representing the structure associated with each individual mutation.

