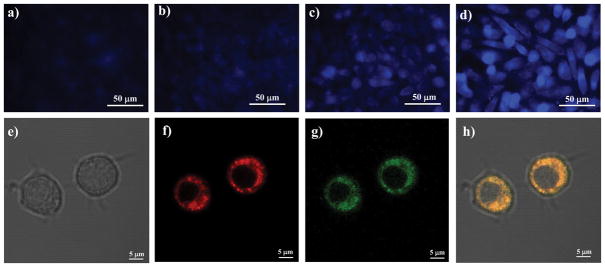
Figure 3. Fluorescent imaging studies of the click reaction between 21 and 22 in Raw264.7 cells.
The click reaction between 21b and 22b resulted in dose-dependent increase in fluorescent intensity, which tracked that of a fluorescent mitochondrion-tracker, while the control click reaction between 21a and 22a only showed negligible fluorescence. Images a, b, c and d show the results from the click reaction between compound 21 and 22. a) RAW 264.7 cells treated with 22a (1 μM) and 21a (1 μM); b) RAW 264.7 cells treated with 22a (5 μM) and 21a (5 μM); c) RAW 264.7 cells treated with 22b (1 μM) and 21b (1 μM); d) RAW 264.7 cells treated with 22b (5 μM) and 21b (5 μM). Images e, f, g and h are confocal images of RAW 264.7 cells treated with compound 21b (5 μM), 22b (2.5 μM) and MT-deep red (50 nM). e) Bright field; f) Red channel; g) DAPI channel; h) Merged images of e), f) and g). Images represent 3 fields of view from 3 independent experiments in triplicate.

