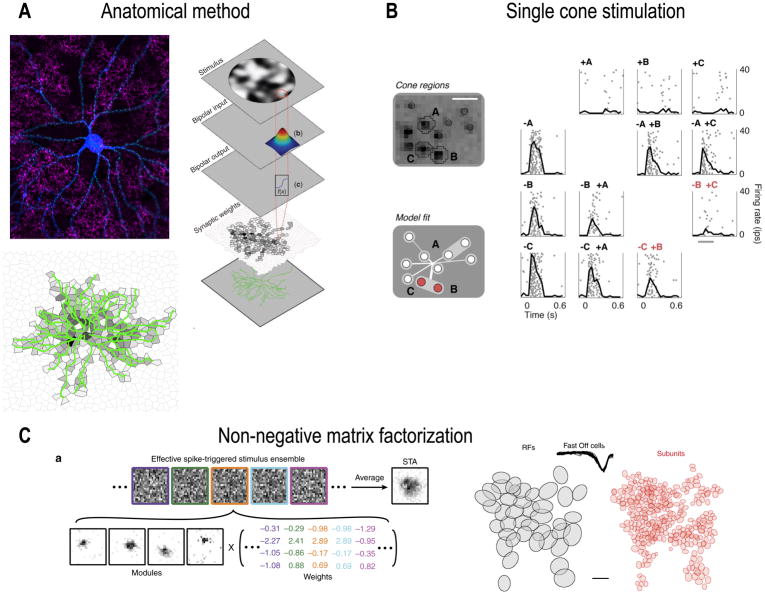
Figure 5. Methods for estimating subunit locations.
(A) In the anatomical method, a RGC cell fill (blue) is combined with a marker of synapses (green) and a stain for a particular bipolar cell type (magenta). A model estimates the number of synapses from each bipolar cell based on the dendritic morphology of the RGC. Adapted from (Gregory W. Schwartz et al., 2012). (B) The single cone stimulation method presents small spots of light aligned to the locations of cones. By presenting pairs of spots and measuring whether the responses combine linearly or nonlinearly in the RGCs, the experimenters were able to infer the locations of RF subunits. Adapted from (Freeman et al., 2015). (C) The non-negative matrix factorization technique is an analytical method that can be applied to data from spatiotemporal white noise experiments (left). The panel at the rights shows the linear RF (gray) and the corresponding subunit RFs (red) estimated from a multi-electrode-array recording in salamander retina. Adapted from (Liu et al., 2017).

